Fig. B.1
Download original image
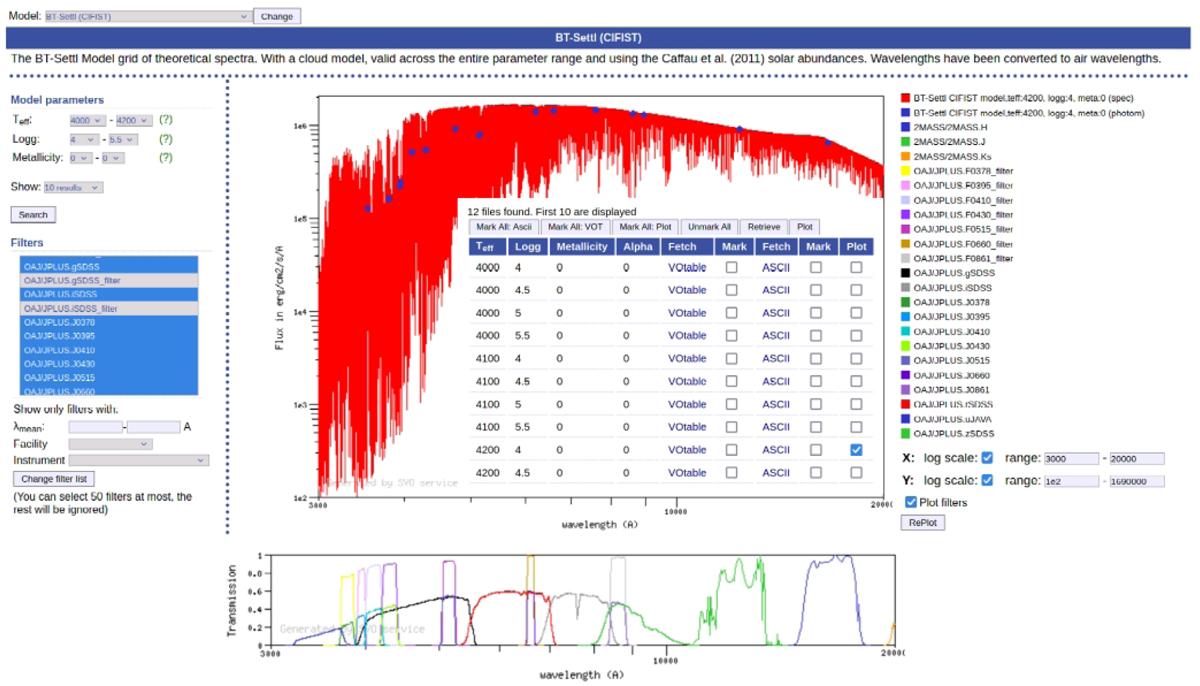
Example of an output from the SVO Synthetic Photometry Server. Once the spectral collection (the CFIST version of the BT-Settl models), the range of physical parameters (4000 K < Teff< 4 250 K; 4 < log g< 5.5 dex), and the collection of filters (2MASS and J-PLUS) have been selected, the system returns, for each combination of a filter and the physical parameters, the corresponding spectrum (in red), the filter transmission curves (in different colours at the bottom), and the computed synthetic photometry in absolute flux units (erg/cm2/s/Å; blue dots overplotted on the red spectrum).
Current usage metrics show cumulative count of Article Views (full-text article views including HTML views, PDF and ePub downloads, according to the available data) and Abstracts Views on Vision4Press platform.
Data correspond to usage on the plateform after 2015. The current usage metrics is available 48-96 hours after online publication and is updated daily on week days.
Initial download of the metrics may take a while.