Fig. 12
Download original image
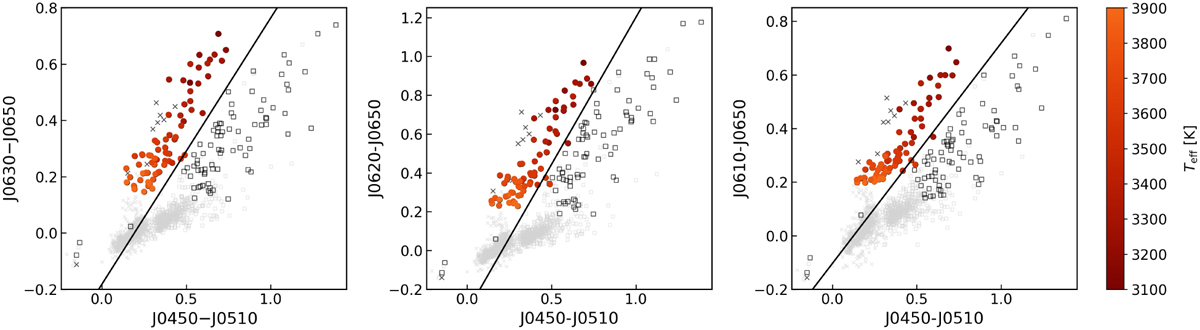
Colour-colour diagrams for M stars (Teff ≤ 3 900 K). The miniJPAS M-dwarf sample is colour-coded according to the derived effective temperature. The M stars from the libraries – MILES, STELIB, and ELODIE – are shown in black, and dwarfs and giants are represented by crosses and squares, respectively. The FGK sample from the libraries is presented in light grey, for reference.
Current usage metrics show cumulative count of Article Views (full-text article views including HTML views, PDF and ePub downloads, according to the available data) and Abstracts Views on Vision4Press platform.
Data correspond to usage on the plateform after 2015. The current usage metrics is available 48-96 hours after online publication and is updated daily on week days.
Initial download of the metrics may take a while.