Fig. 10
Download original image
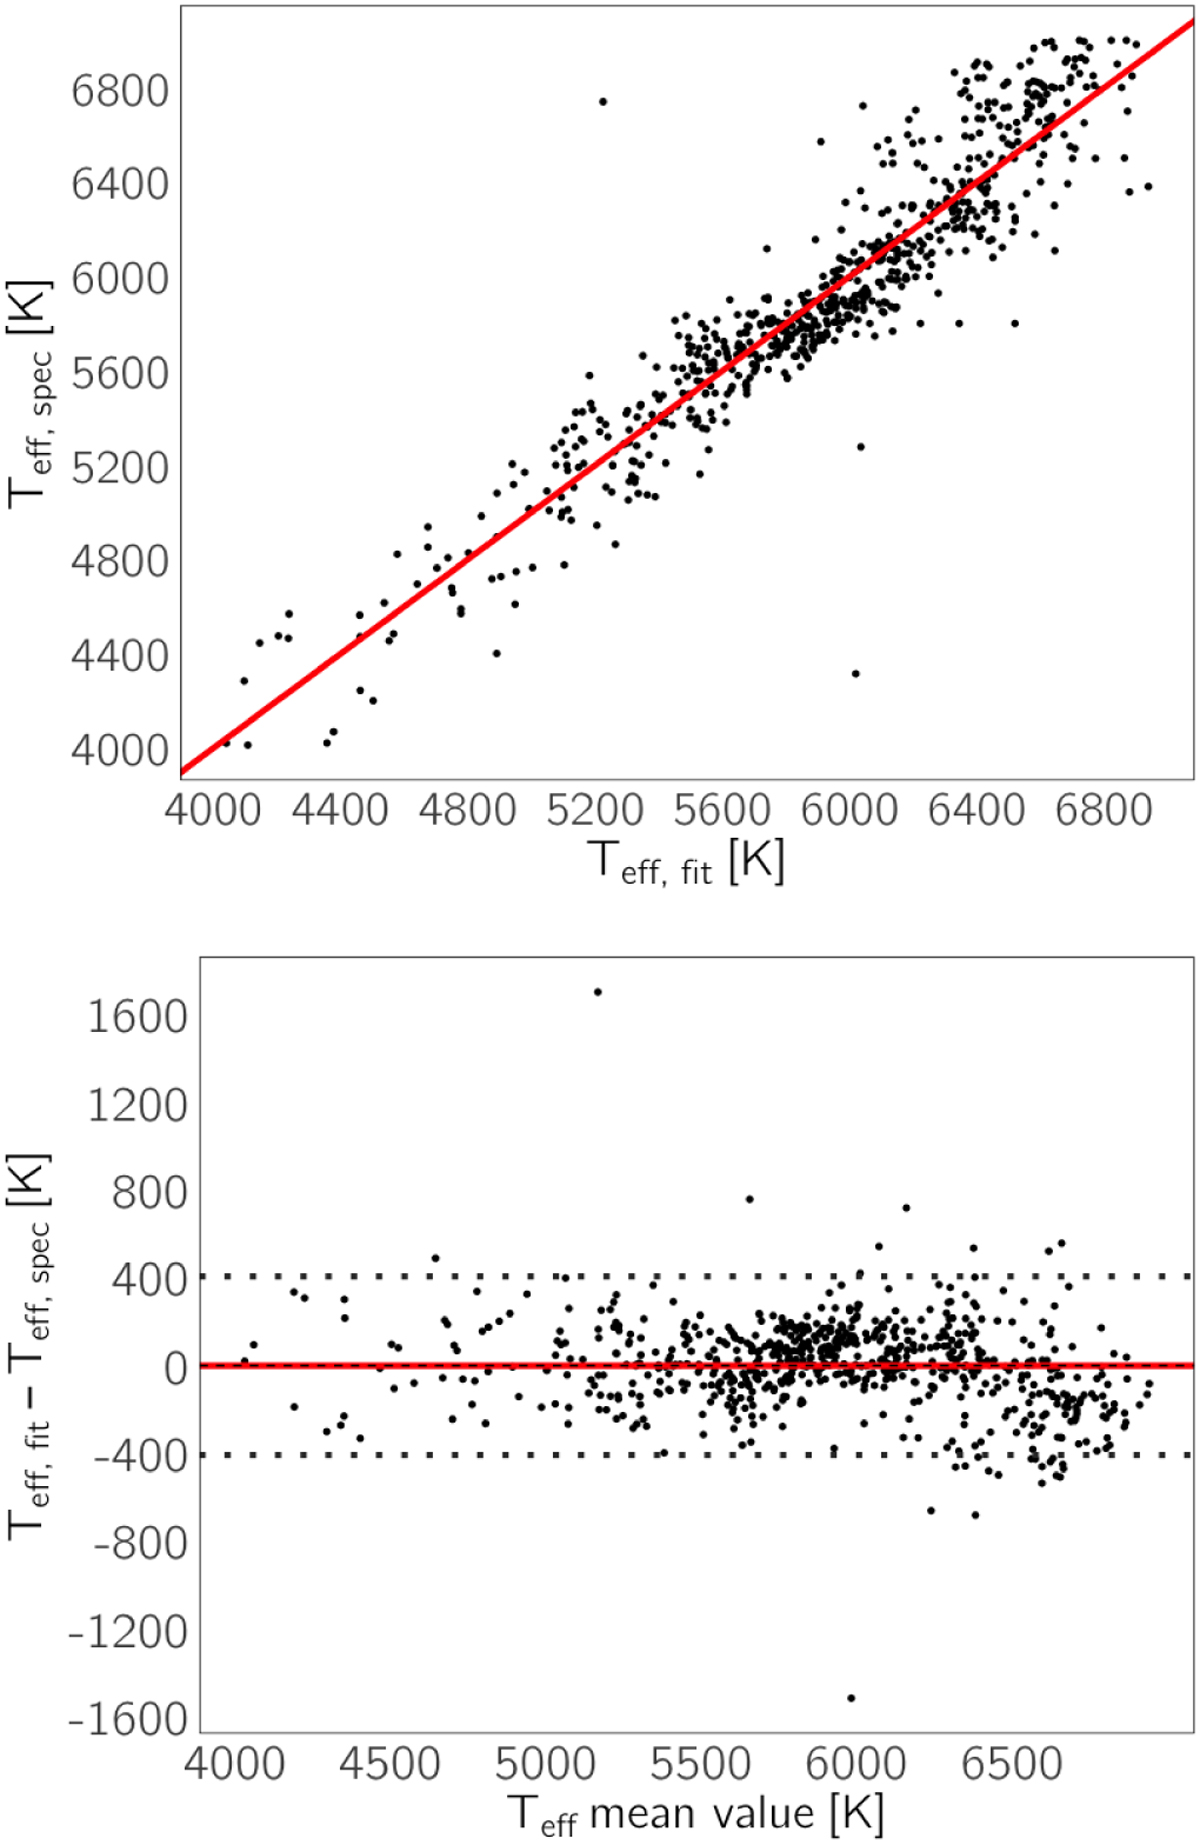
Comparison between photometric and spectroscopic temperatures. Top panel: the x axis shows the estimated photometric temperatures using the derived polynomial function and the y axis shows the spectroscopic values from libraries. Bottom panel: the Bland–Altman plot comparing both values, in which the x axis shows the mean values between the two temperatures and the y axis shows the difference between them.
Current usage metrics show cumulative count of Article Views (full-text article views including HTML views, PDF and ePub downloads, according to the available data) and Abstracts Views on Vision4Press platform.
Data correspond to usage on the plateform after 2015. The current usage metrics is available 48-96 hours after online publication and is updated daily on week days.
Initial download of the metrics may take a while.