Fig. 6.
Download original image
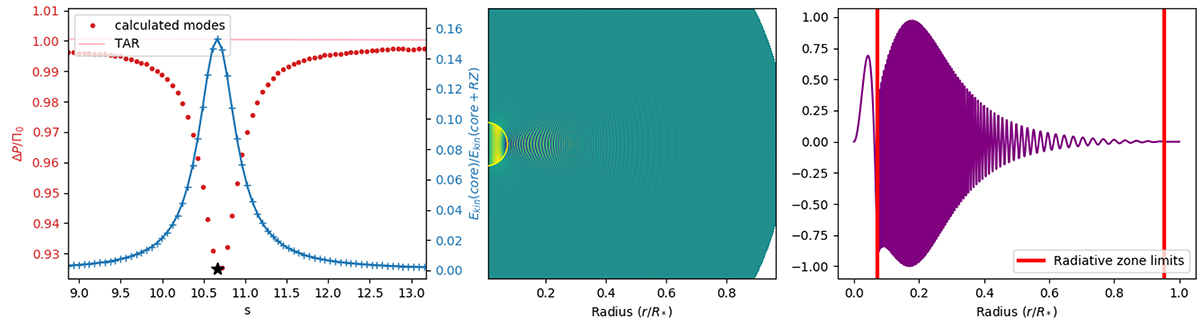
Example of a resonant mode. Left panel: Period spacing ΔPco as a function of the spin parameter for the series (ℓ = 1, m = −1) and for the 1z model at a rotation rate of Ω = 0.1ΩK. Red dots represent computed modes. The pink line shows the TAR. The blue line shows the proportion of kinetic energy in the core for each mode. Middle panel: Quantity ![]() plotted in a meridional plane for the mode marked by a black star in the left panel. Right panel: Radial profile of
plotted in a meridional plane for the mode marked by a black star in the left panel. Right panel: Radial profile of ![]() at the latitude π/2 (equator). The factor
at the latitude π/2 (equator). The factor ![]() is a scaling factor used to make the visualisation easier. The red vertical lines show the radiative zone limits.
is a scaling factor used to make the visualisation easier. The red vertical lines show the radiative zone limits.
Current usage metrics show cumulative count of Article Views (full-text article views including HTML views, PDF and ePub downloads, according to the available data) and Abstracts Views on Vision4Press platform.
Data correspond to usage on the plateform after 2015. The current usage metrics is available 48-96 hours after online publication and is updated daily on week days.
Initial download of the metrics may take a while.