Open Access
Fig. 1.
Download original image
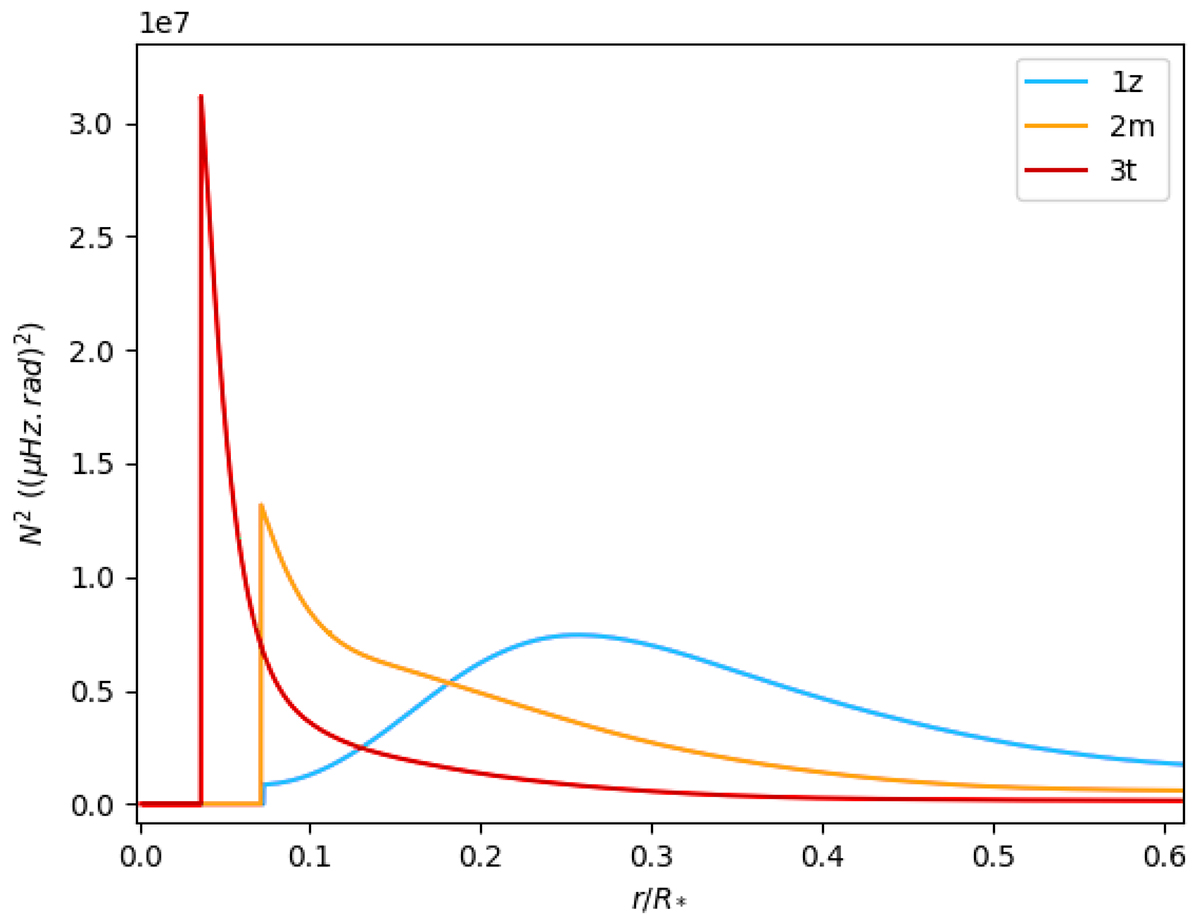
Squared Brunt-Väisälä frequency N2 of the models presented in Table 1 as a function of the relative radius. Model 1z is drawn in blue, 2m in orange, and 3t in red.
Current usage metrics show cumulative count of Article Views (full-text article views including HTML views, PDF and ePub downloads, according to the available data) and Abstracts Views on Vision4Press platform.
Data correspond to usage on the plateform after 2015. The current usage metrics is available 48-96 hours after online publication and is updated daily on week days.
Initial download of the metrics may take a while.