Fig. 8
Download original image
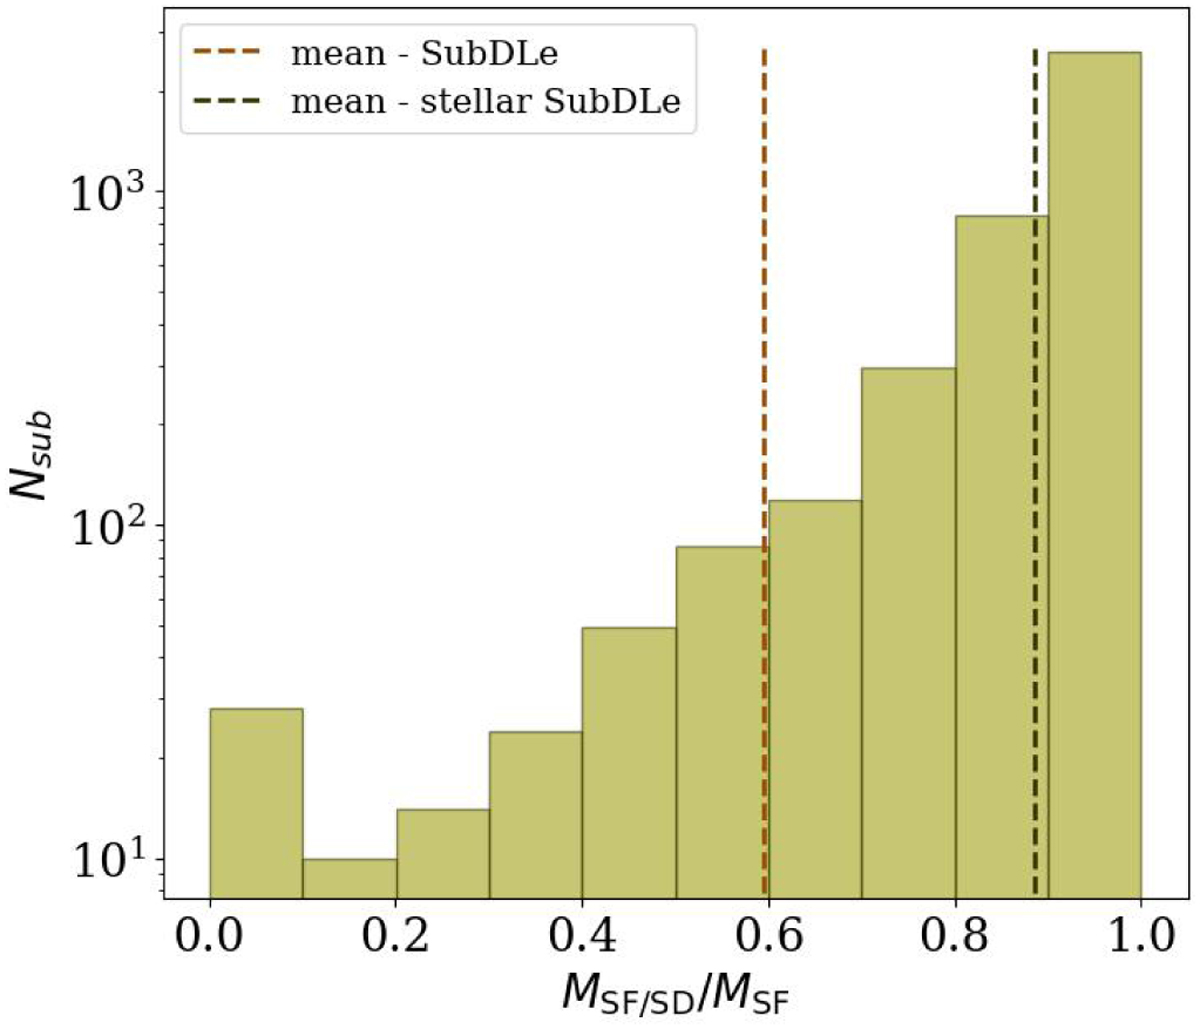
Distribution of the ratio MSF/SD/MSF in all galaxies identified by our stellar SubDLe and matched to a SubFind substructure for all the 12 clusters analyzed at z = 0. The mean value is traced by the black dashed line, while the orange dashed line represents the mean value for the all-particle run of SubDLe on cluster CL-2 (associated with the orange histogram shown in Fig. 7).
Current usage metrics show cumulative count of Article Views (full-text article views including HTML views, PDF and ePub downloads, according to the available data) and Abstracts Views on Vision4Press platform.
Data correspond to usage on the plateform after 2015. The current usage metrics is available 48-96 hours after online publication and is updated daily on week days.
Initial download of the metrics may take a while.