Open Access
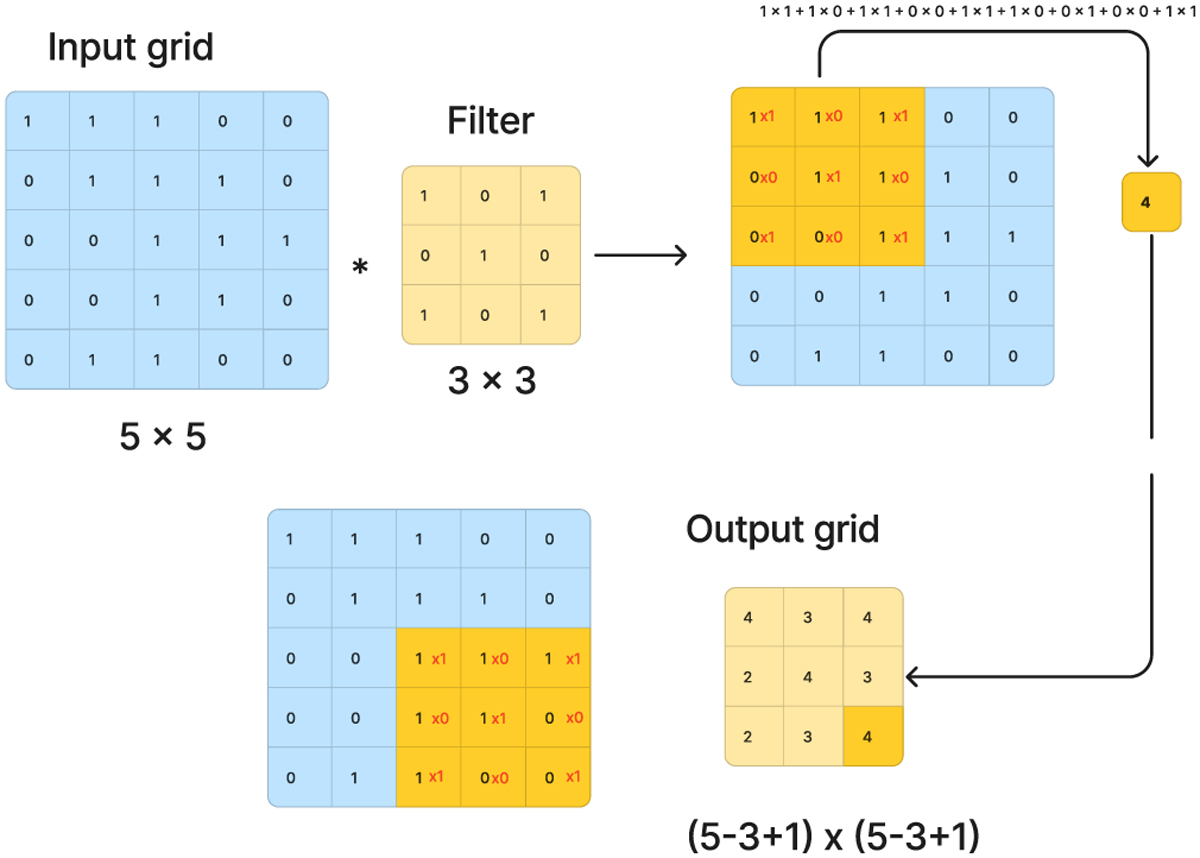
Fig. A.1
Download original image
Schematic representation of a convolution between a 5 × 5 grid and a 3 × 3 filter, with depth 1. The filter is slid across the grid and the dot-product is performed at each alignment (represented by the yellow subset of the grid in the figure), until all the grid is covered and the 3 × 3 output grid is completed.
Current usage metrics show cumulative count of Article Views (full-text article views including HTML views, PDF and ePub downloads, according to the available data) and Abstracts Views on Vision4Press platform.
Data correspond to usage on the plateform after 2015. The current usage metrics is available 48-96 hours after online publication and is updated daily on week days.
Initial download of the metrics may take a while.