Fig. 12
Download original image
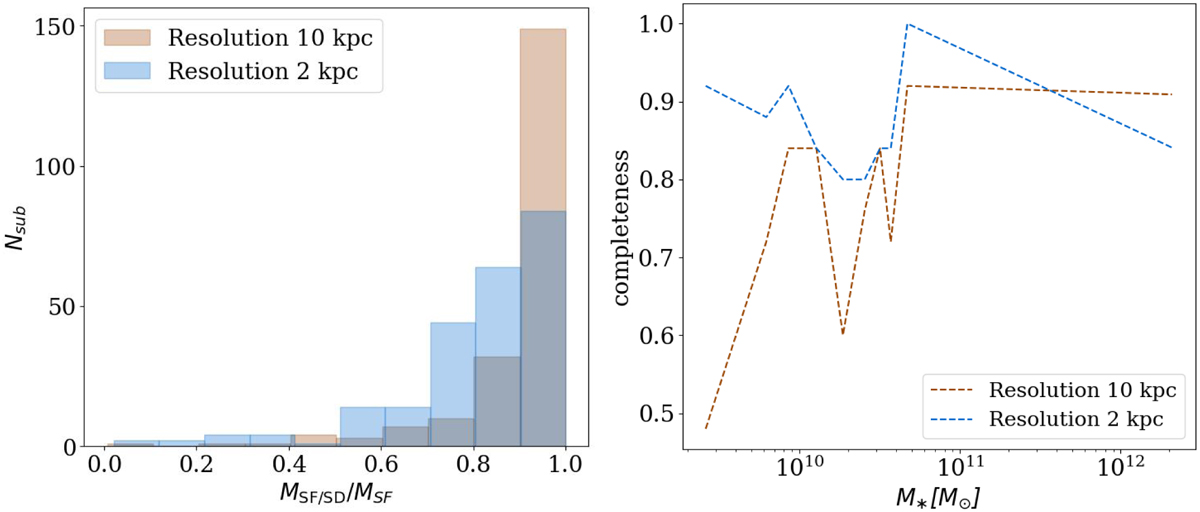
Comparison of the performance of SubDLe on the same cluster, with different d grid resolutions. Left panel: distributions of values of MSF/SD/MSF for SubDLe galaxies matched to SubFind galaxies. Results are shown for the cluster CL-13 at z = 1, for SubDLe runs with the standard resolution of 10 kpc (orange) and with the higher resolution of 2 kpc (blue). Right panel: stellar SubDLe completeness as a function of stellar mass in cluster CL-13 at z = 1, for 2 kpc (blue) and 10 kpc (orange) resolution.
Current usage metrics show cumulative count of Article Views (full-text article views including HTML views, PDF and ePub downloads, according to the available data) and Abstracts Views on Vision4Press platform.
Data correspond to usage on the plateform after 2015. The current usage metrics is available 48-96 hours after online publication and is updated daily on week days.
Initial download of the metrics may take a while.