Fig. 10
Download original image
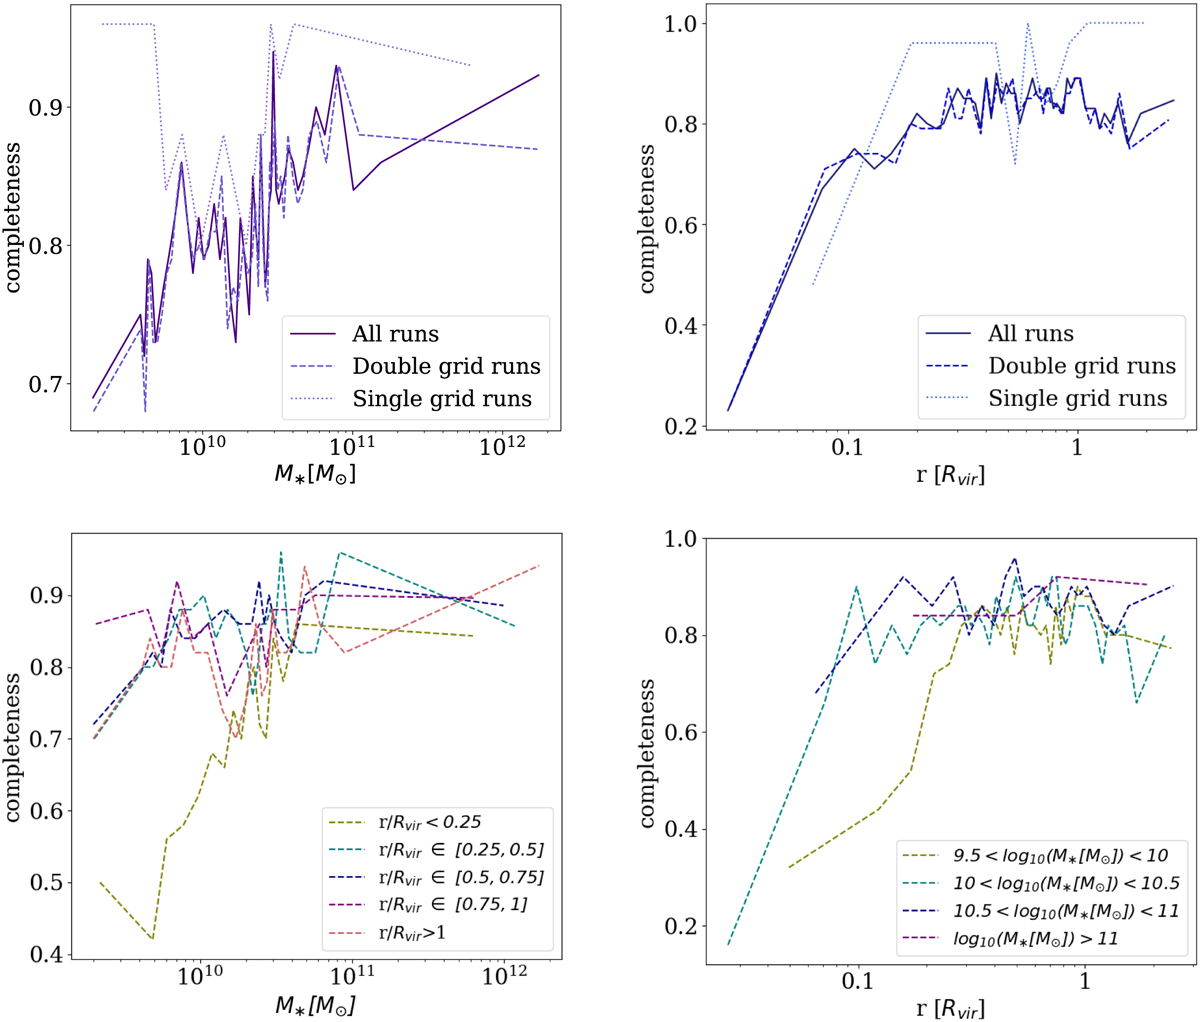
Dependence of the stellar SubDLe completeness (defined as the fraction of SubFind galaxies identified by our stellar SubDLe) on SubFind stellar masses (left panels) and on 3D distance from the cluster center (in units of virial radii, right panels), for all the clusters analyzed at z = 0 (see Table 2). In the upper panels we show, with solid lines, the results for all the analyzed clusters, while dashed and dotted lines represent clusters analyzed with a single grid and a double grid, respectively. In the lower left panel different colors of the dashed curves correspond to different radial bins, as indicated in the legend. In the lower right panel different colors correspond instead to different intervals of the stellar mass of the galaxies, as indicated in the legend.
Current usage metrics show cumulative count of Article Views (full-text article views including HTML views, PDF and ePub downloads, according to the available data) and Abstracts Views on Vision4Press platform.
Data correspond to usage on the plateform after 2015. The current usage metrics is available 48-96 hours after online publication and is updated daily on week days.
Initial download of the metrics may take a while.