Fig. 1
Download original image
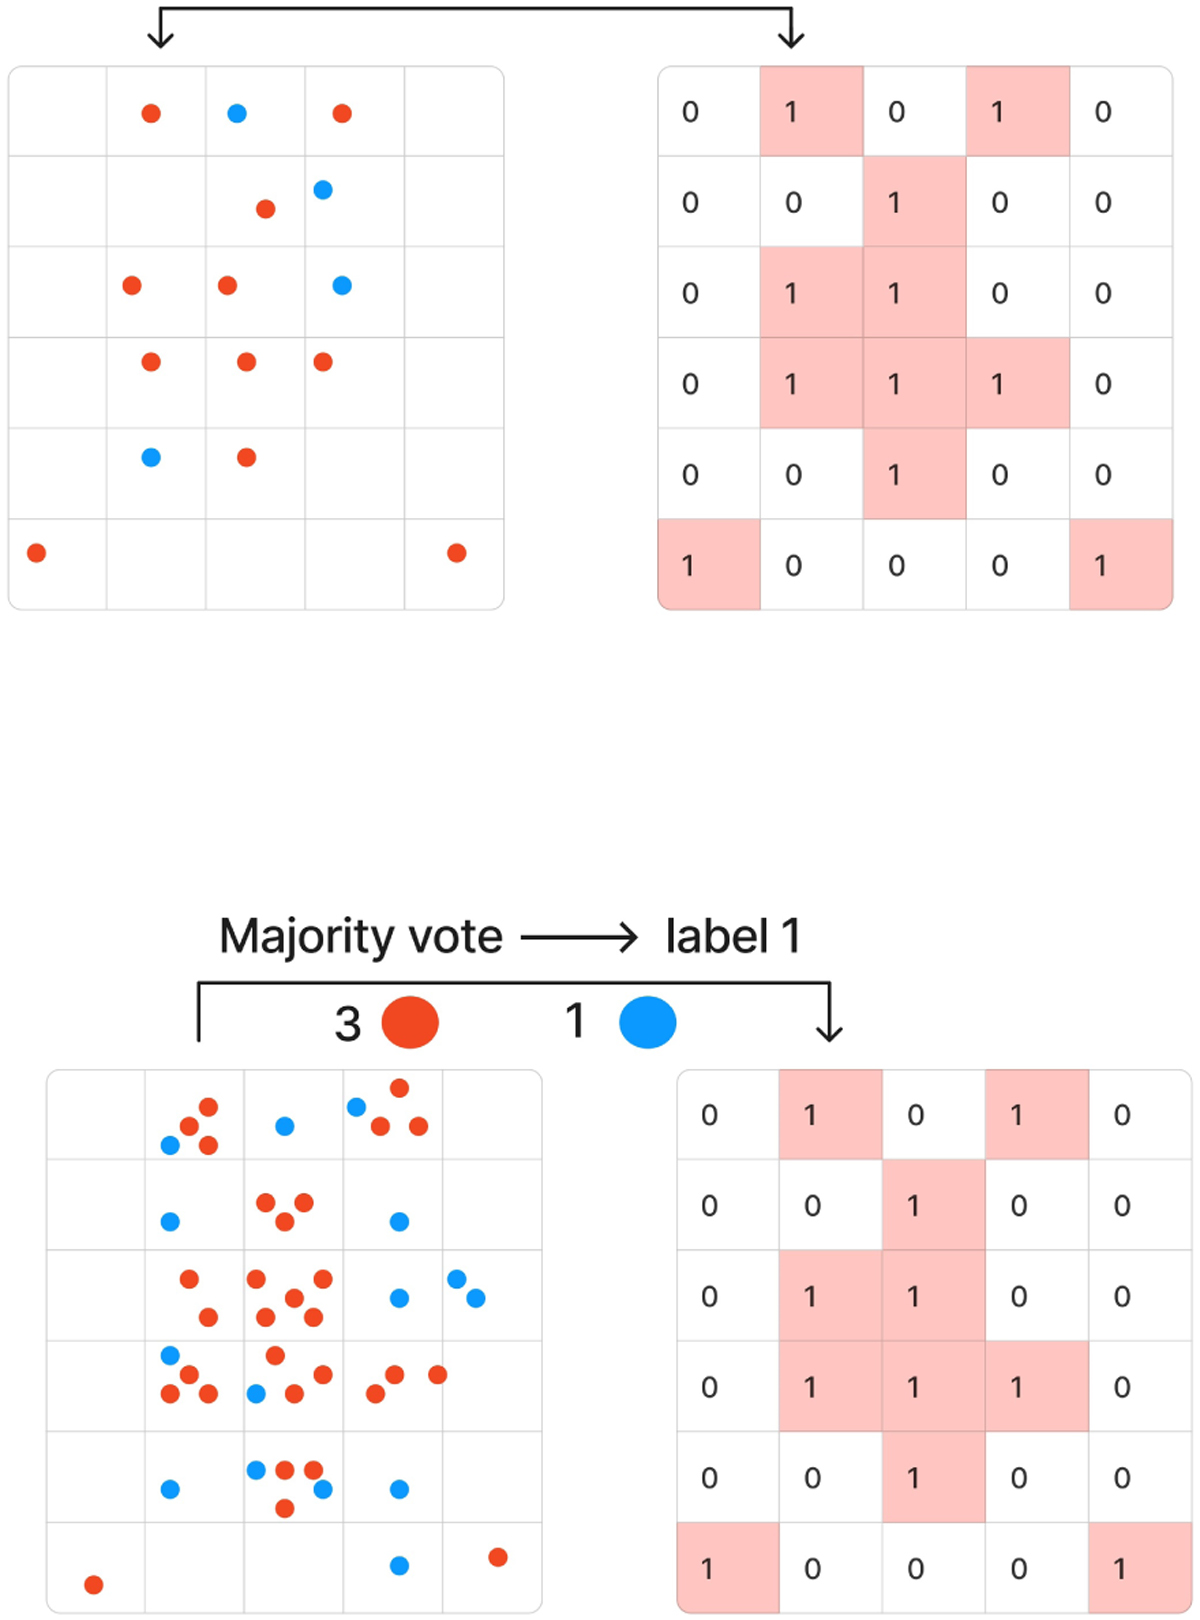
Example of the assignment scheme of labels adopted in the training set of the 3D U-Net within SubDLe. Here red particles trace the substructures to be identified, and blue particles are part of a background. In the upper panel, at most one particle is present in each grid pixel, thus the substructures (associated with the label “1” in the right-hand grid, whereas the background is labeled as “0”) are simply those containing one red particle. In the lower panel, more than one particle is allowed in each grid pixel, so the assignment of labels is performed with a majority vote.
Current usage metrics show cumulative count of Article Views (full-text article views including HTML views, PDF and ePub downloads, according to the available data) and Abstracts Views on Vision4Press platform.
Data correspond to usage on the plateform after 2015. The current usage metrics is available 48-96 hours after online publication and is updated daily on week days.
Initial download of the metrics may take a while.