Fig. G.1
Download original image
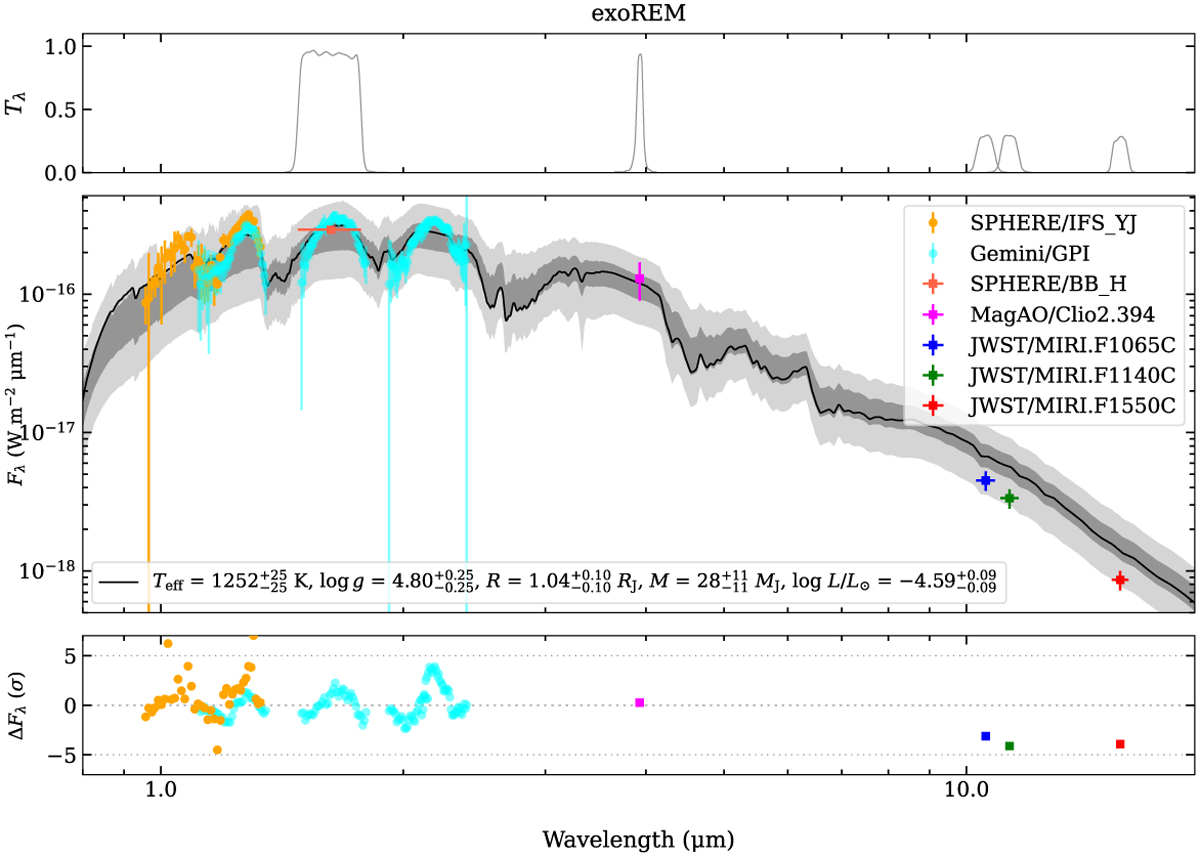
Same as Figure 15 but for the best-fit model using Exo-REM grid via χ2 mapping with all the available datasets. The model correspond to the dotted green line in Figure 18. Regions colored with different shades of gray correspond to 2− and 3 − σ uncertainties, and the black line to the best-fit model. The different colored symbols correspond to the observations.
Current usage metrics show cumulative count of Article Views (full-text article views including HTML views, PDF and ePub downloads, according to the available data) and Abstracts Views on Vision4Press platform.
Data correspond to usage on the plateform after 2015. The current usage metrics is available 48-96 hours after online publication and is updated daily on week days.
Initial download of the metrics may take a while.