Fig. C.2
Download original image
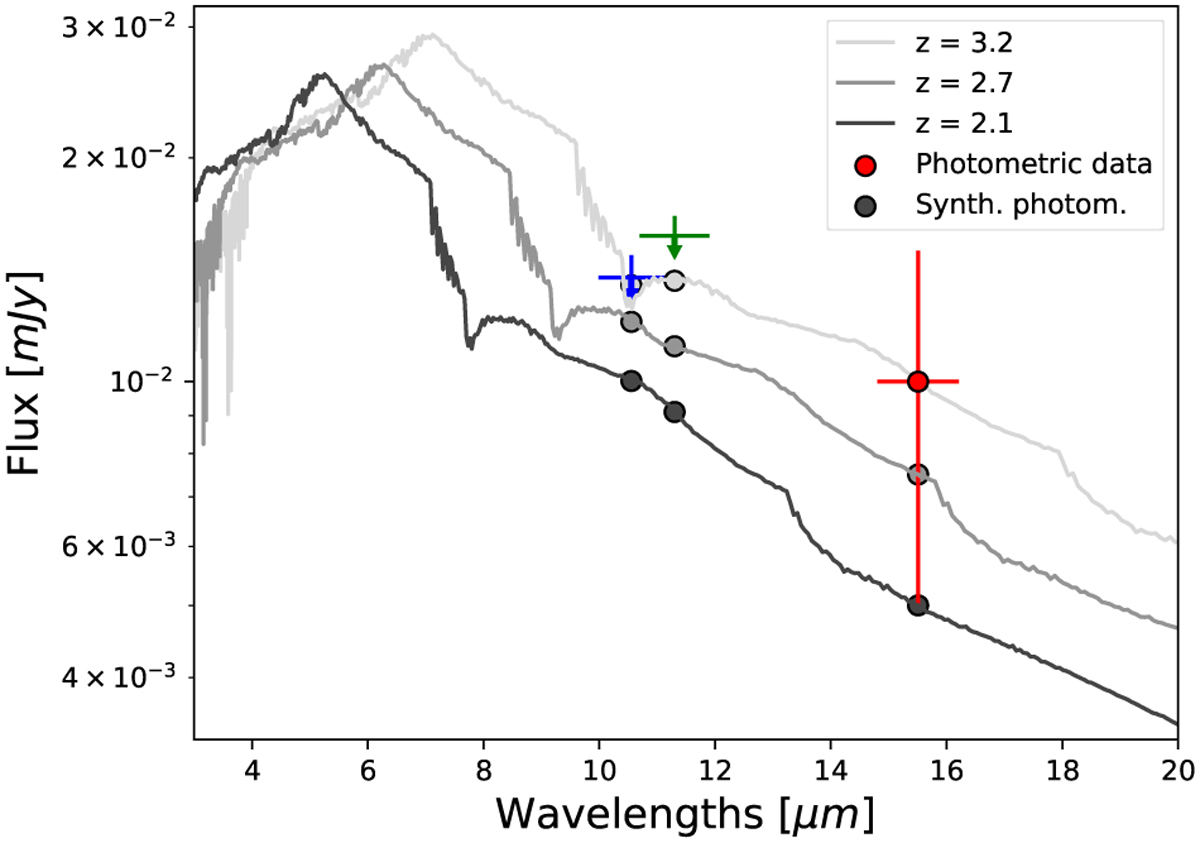
Spectral energy distribution of the source labeled “bkg,” assuming a galaxy nature. The red dot corresponds to the photometry at 15μm, while the arrows are upper limits at 10μm and 11μm. The vertical lines denote the uncertainties, and the horizontal lines the Weff of each filter. The gray lines are the galaxy models from Bruzual & Charlot (2003) at three different redshifts that better represent the actual data. The black dots are the synthetic photometry of each galaxy model.
Current usage metrics show cumulative count of Article Views (full-text article views including HTML views, PDF and ePub downloads, according to the available data) and Abstracts Views on Vision4Press platform.
Data correspond to usage on the plateform after 2015. The current usage metrics is available 48-96 hours after online publication and is updated daily on week days.
Initial download of the metrics may take a while.