Fig. 19
Download original image
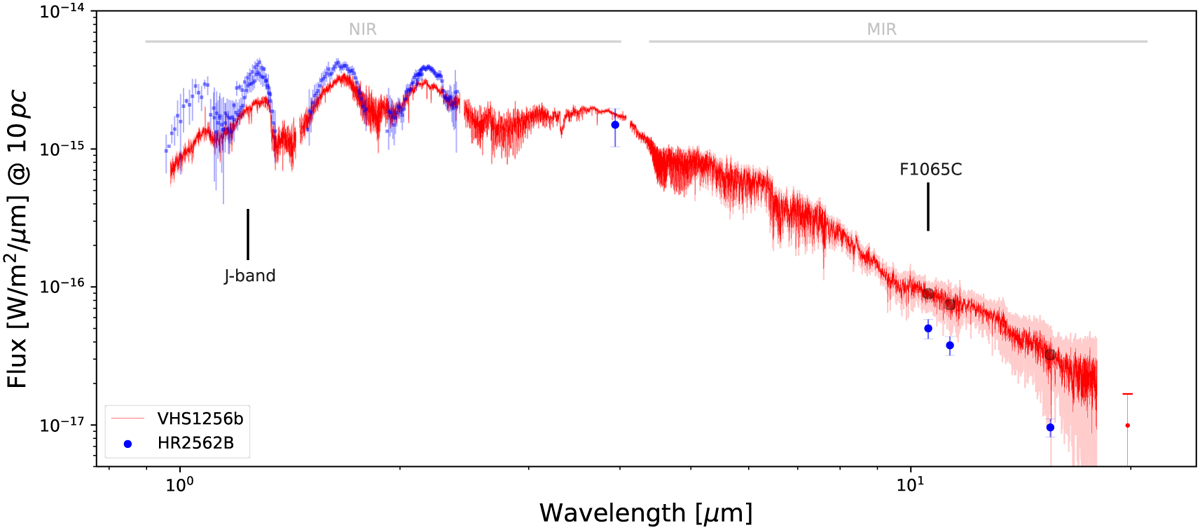
Spectral energy distribution of both HR 2562 B (blue dots) and VHS 1256 b (red line and dot). The vertical lines highlight the J and F1065C bands for comparison purposes (see main text). The fluxes were normalized at 10 pc. The filled red area and errorbars correspond to 1−σ uncertainties. The error bars of the first and last points in the Y-, J-, H-, and K-bands of HR 2562 B IFS data were set to zero for aesthetic purposes. The dark red dots are the synthetic MIRI photometry of VHS 1256 b.
Current usage metrics show cumulative count of Article Views (full-text article views including HTML views, PDF and ePub downloads, according to the available data) and Abstracts Views on Vision4Press platform.
Data correspond to usage on the plateform after 2015. The current usage metrics is available 48-96 hours after online publication and is updated daily on week days.
Initial download of the metrics may take a while.