Fig. 18
Download original image
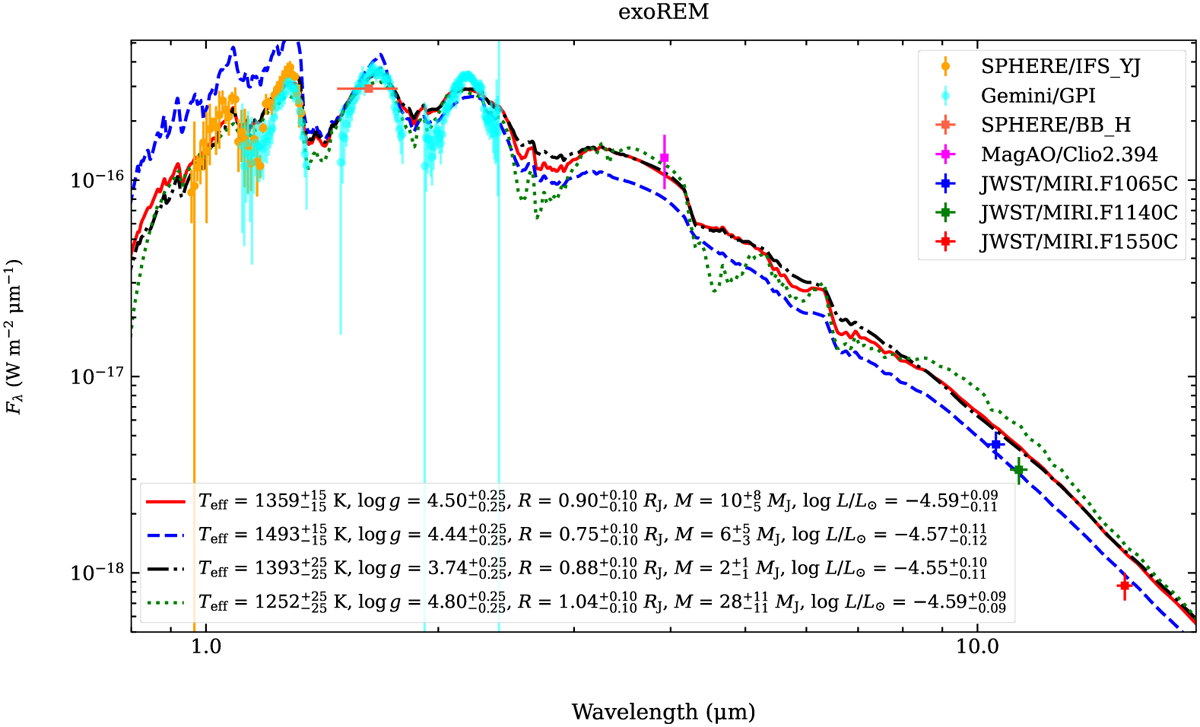
Best-fit models using the Exo-REM grid via χ2 mapping. The different colored lines correspond to the different combinations shown in Table 6. The red solid line uses the NIR data; the dashed blue line the MIRI data; the dashed-dotted black line the MIRI, SPHERE, and MagAO data; the dotted green line the full dataset. The colored symbols correspond to the different observational data.
Current usage metrics show cumulative count of Article Views (full-text article views including HTML views, PDF and ePub downloads, according to the available data) and Abstracts Views on Vision4Press platform.
Data correspond to usage on the plateform after 2015. The current usage metrics is available 48-96 hours after online publication and is updated daily on week days.
Initial download of the metrics may take a while.