Fig. 17
Download original image
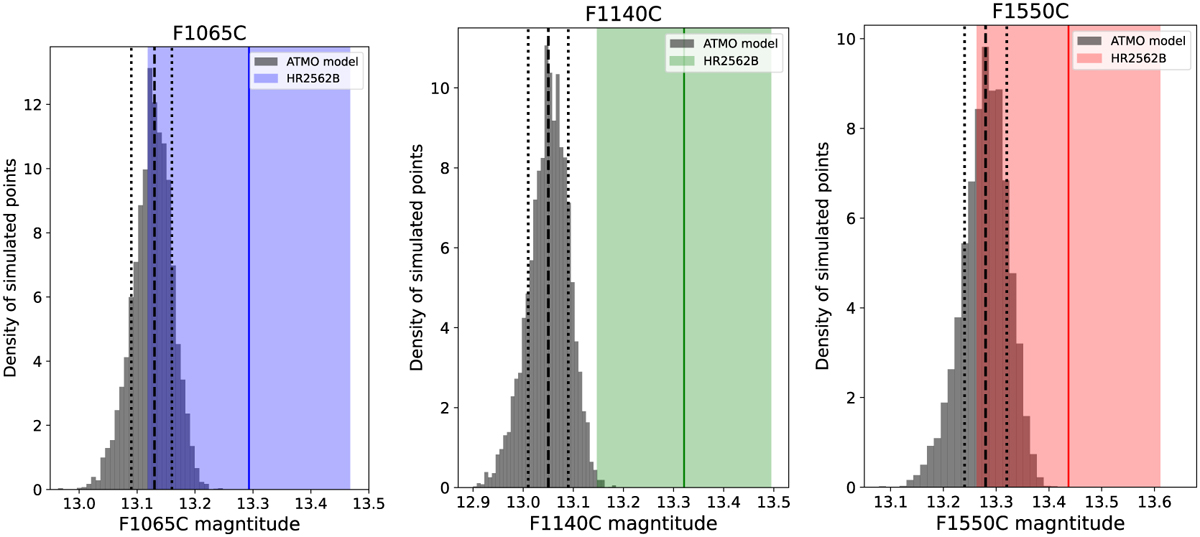
Histogram of synthetic magnitudes obtained from the best-fit model from ATMO using MCMC (10 000 points), which includes all the observations of HR 2562 B. From left to right: magnitudes at F1065C, F1140C, and F1550C filters. The colored vertical lines and filled, transparent area correspond to the magnitude and uncertainties of HR 2562 B at each filter. The dotted and dashed vertical black lines in each subplot correspond to 15.9%, 50%, and 81.1% percentiles, respectively.
Current usage metrics show cumulative count of Article Views (full-text article views including HTML views, PDF and ePub downloads, according to the available data) and Abstracts Views on Vision4Press platform.
Data correspond to usage on the plateform after 2015. The current usage metrics is available 48-96 hours after online publication and is updated daily on week days.
Initial download of the metrics may take a while.