Fig. 16
Download original image
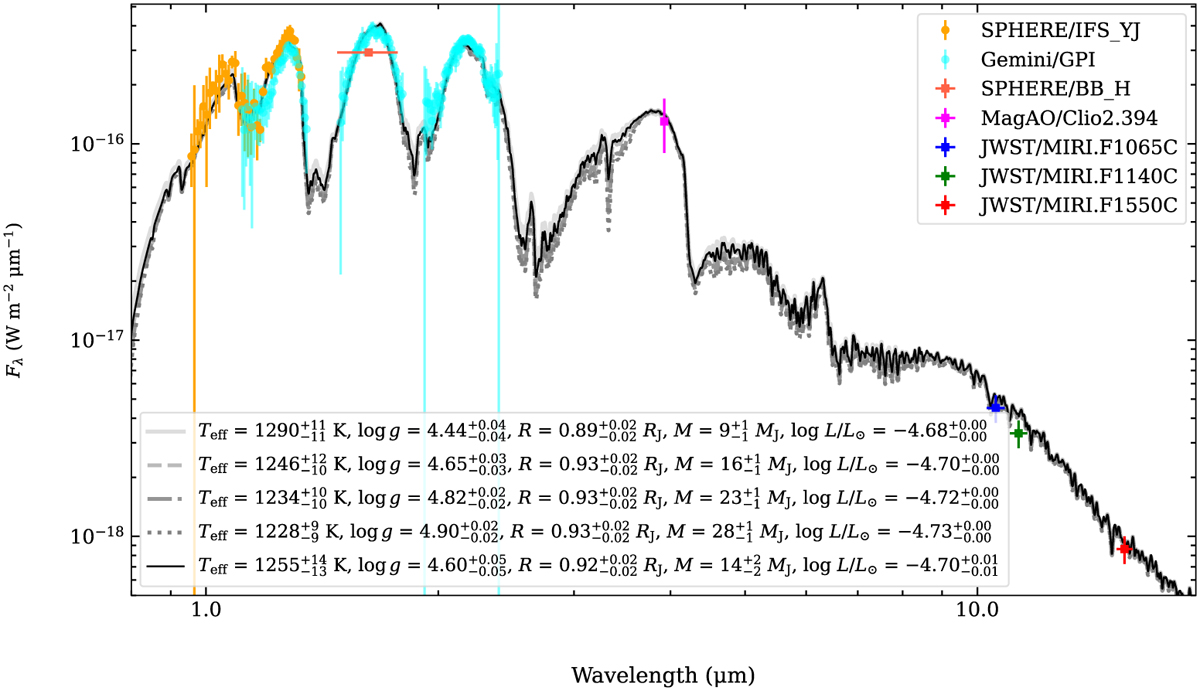
SED fitting using the ATMO models with different prior in masses and the full dataset. The different black and gray lines styles correspond to the different best fit for each prior: solid light gray line uses a 10 MJup prior; gray dashed line a 18 MJup prior; dashed-dotted black line 25 MJup prior; dotted black line a 30 MJup prior; and the solid black line the no prior case. The colored symbols correspond to the observational datasets.
Current usage metrics show cumulative count of Article Views (full-text article views including HTML views, PDF and ePub downloads, according to the available data) and Abstracts Views on Vision4Press platform.
Data correspond to usage on the plateform after 2015. The current usage metrics is available 48-96 hours after online publication and is updated daily on week days.
Initial download of the metrics may take a while.