Fig. 15
Download original image
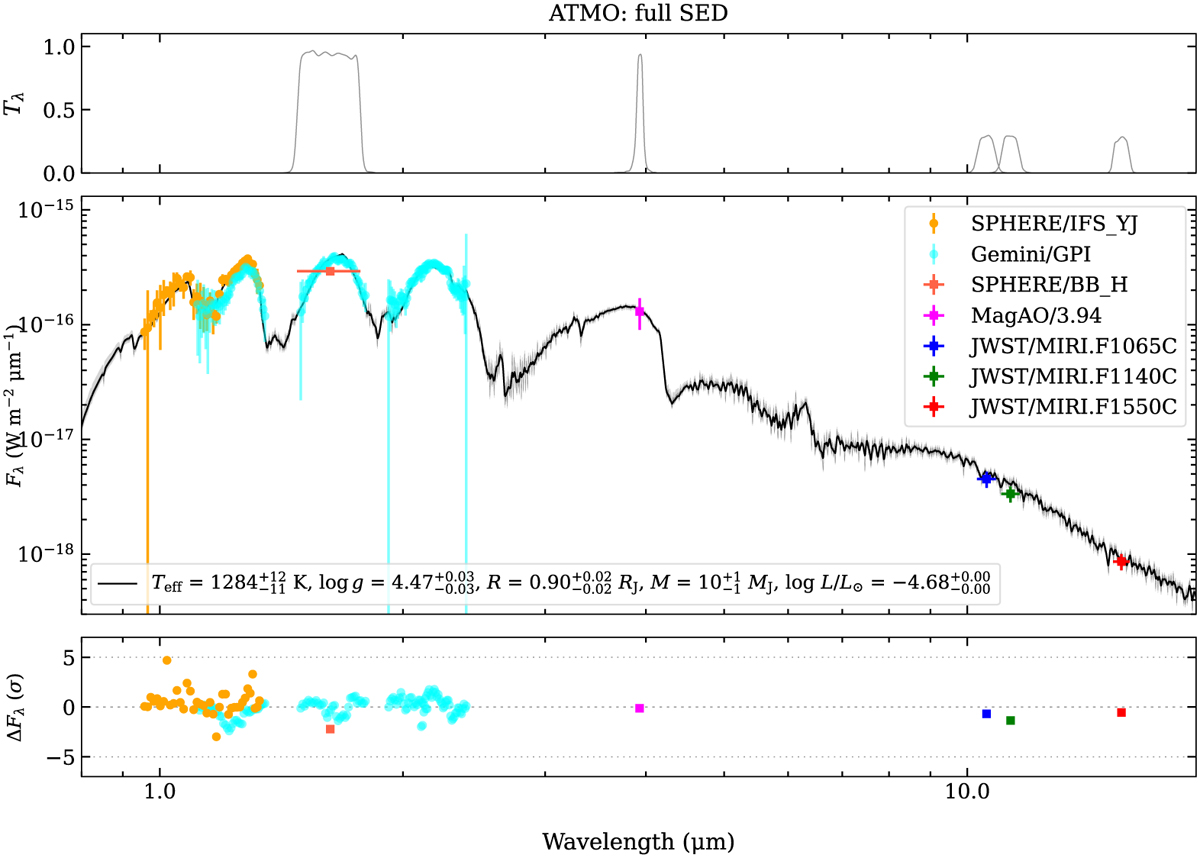
Best fit model using ATMO and the entire set of data. Top panel: transmission filters. Middle panel: SED fitting. Bottom panel: residuals from the fit. The black and gray lines in the middle panel correspond to the best fit from ATMO and the respective uncertainties. The different color symbols are the dataset. The uncertainty for the luminosity corresponds to 0.0049.
Current usage metrics show cumulative count of Article Views (full-text article views including HTML views, PDF and ePub downloads, according to the available data) and Abstracts Views on Vision4Press platform.
Data correspond to usage on the plateform after 2015. The current usage metrics is available 48-96 hours after online publication and is updated daily on week days.
Initial download of the metrics may take a while.