Fig. 14
Download original image
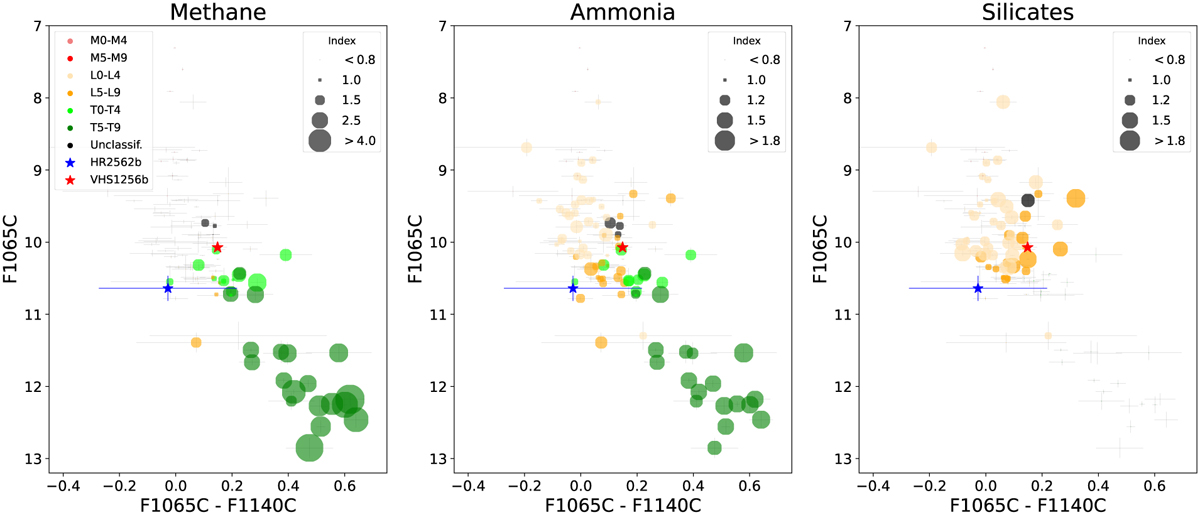
Color-magnitude diagram using the 10μm and 11μm filters from MIRI. The dots correspond to the photometry obtained from the Spitzer spectra sample (Suárez & Metchev 2022), while the colors refer to the spectral type. The subplots correspond to the same color-magnitude diagram but show the methane (left), ammonia (middle), and silicates (right) spectral indices, as defined in Suárez & Metchev (2022), related to the depth of the absorption feature of each component. The circle sizes in each subplot refer to the value of the spectral index, as defined by Suárez & Metchev (2022). The gray dots in each sub-panel correspond to species non-detection (i.e., plotted with index=0, non-highlighted sources). The black dots refer to unclassified spectral types. The blue star corresponds to HR 2562 B, and the red star to VHS 1256 b from Miles et al. (2023). Note that the Y-axis (i.e., F1065C) refers to the absolute magnitude.
Current usage metrics show cumulative count of Article Views (full-text article views including HTML views, PDF and ePub downloads, according to the available data) and Abstracts Views on Vision4Press platform.
Data correspond to usage on the plateform after 2015. The current usage metrics is available 48-96 hours after online publication and is updated daily on week days.
Initial download of the metrics may take a while.