Fig. 10
Download original image
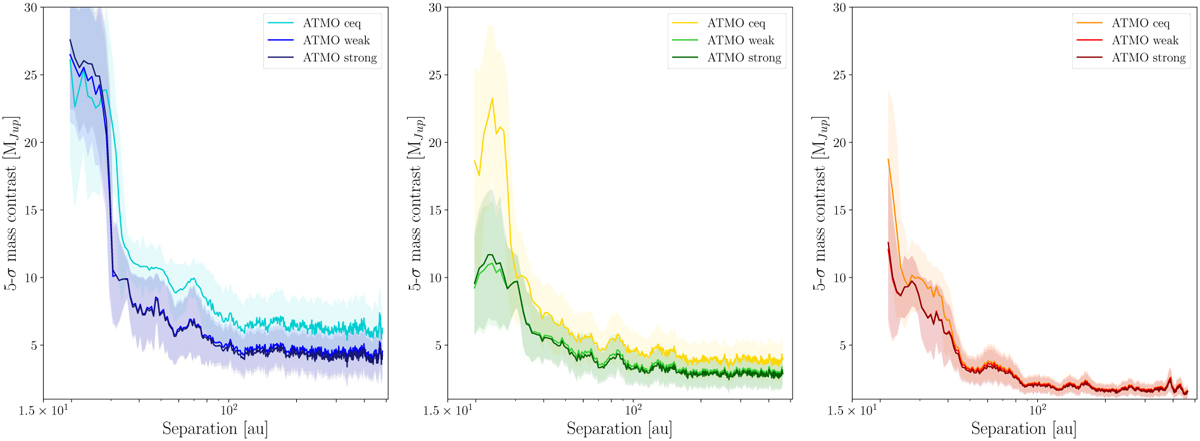
Mass sensitivity as a function of projected separation. From left to right: mass limit at 10 μm (F1065C), 11 μm (F1140C), and 15 μm (F1550C). The different curves in each subplot correspond to the different ATMO models used: Chemical equilibrium, weak chemical disequilibrium, and strong chemical disequilibrium. The shaded areas correspond to 1σ uncertainty.
Current usage metrics show cumulative count of Article Views (full-text article views including HTML views, PDF and ePub downloads, according to the available data) and Abstracts Views on Vision4Press platform.
Data correspond to usage on the plateform after 2015. The current usage metrics is available 48-96 hours after online publication and is updated daily on week days.
Initial download of the metrics may take a while.