Fig. 7.
Download original image
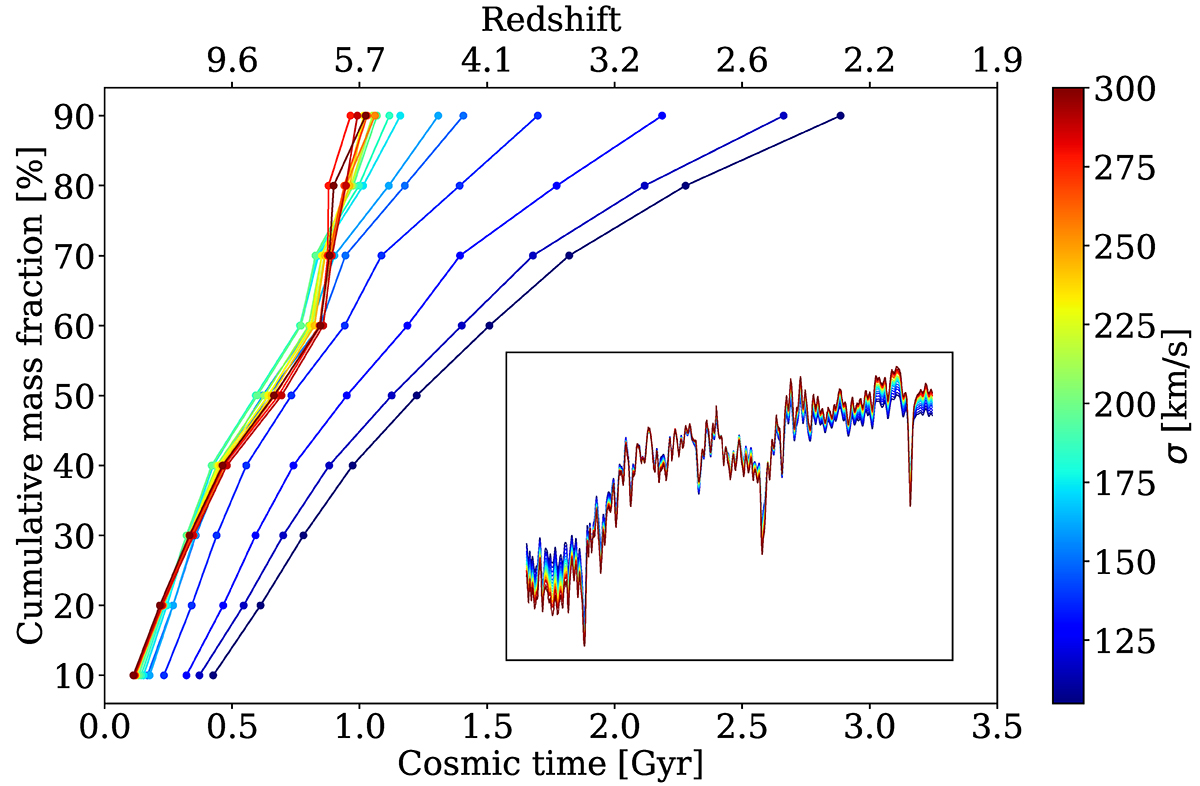
Median values of the posterior distributions obtained for the stellar mass percentiles of 18 stacks, as a function of cosmic time (in Gyr) and redshift, coloured according to their velocity dispersions (in km s−1). Redder colours indicate higher velocity dispersions (more massive galaxies), and bluer ones lower velocity dispersions (less massive ones). In the inset, we plot the observed spectra, normalised and in the wavelength range [4023, 6000] Å, with the same colour map.
Current usage metrics show cumulative count of Article Views (full-text article views including HTML views, PDF and ePub downloads, according to the available data) and Abstracts Views on Vision4Press platform.
Data correspond to usage on the plateform after 2015. The current usage metrics is available 48-96 hours after online publication and is updated daily on week days.
Initial download of the metrics may take a while.