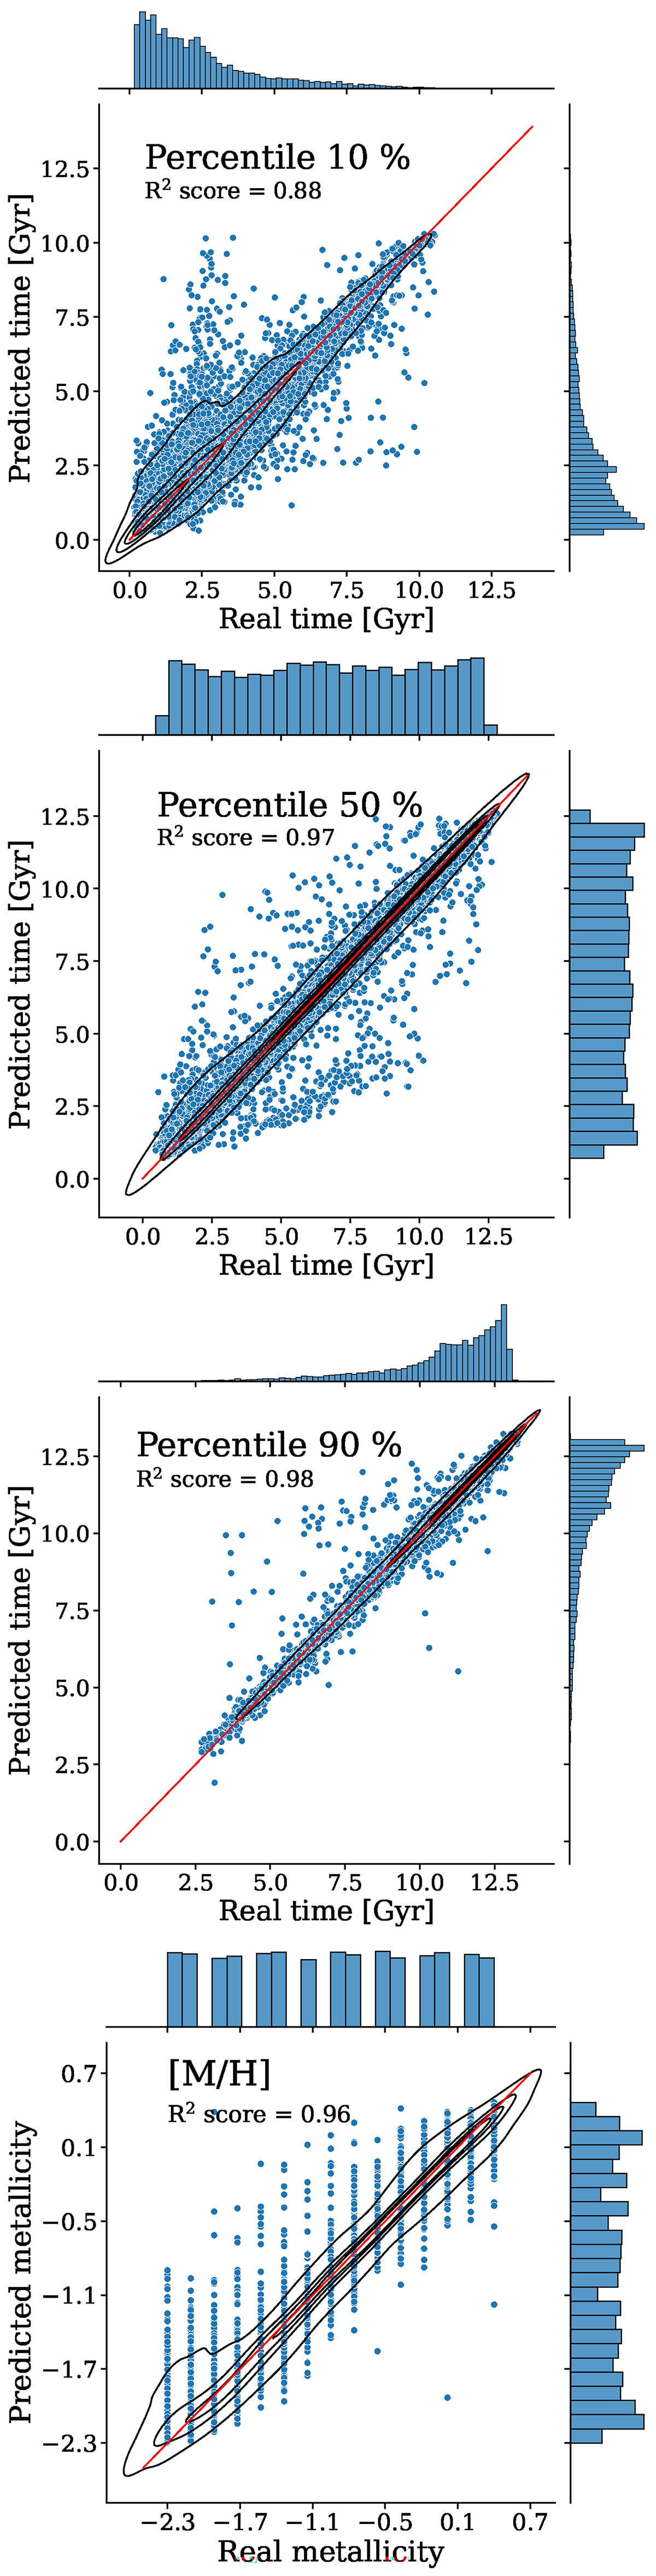
Fig. 3.
Download original image
Median values of the posterior distributions estimated for the percentiles 10%, 50%, and 90% and [M/H], compared to the true values. The R2 score achieved for each prediction is 0.88, 0.97, 0.98, and 0.96, respectively. Each blue dot is a different sample from the test set. The red line shows the one-to-one relation, the histograms at the right of each panel show the marginal distributions of the predictions, and the histograms of the real data are shown at the top. Kernel density estimation contours are drawn in black at iso-proportions of the density of samples.
Current usage metrics show cumulative count of Article Views (full-text article views including HTML views, PDF and ePub downloads, according to the available data) and Abstracts Views on Vision4Press platform.
Data correspond to usage on the plateform after 2015. The current usage metrics is available 48-96 hours after online publication and is updated daily on week days.
Initial download of the metrics may take a while.