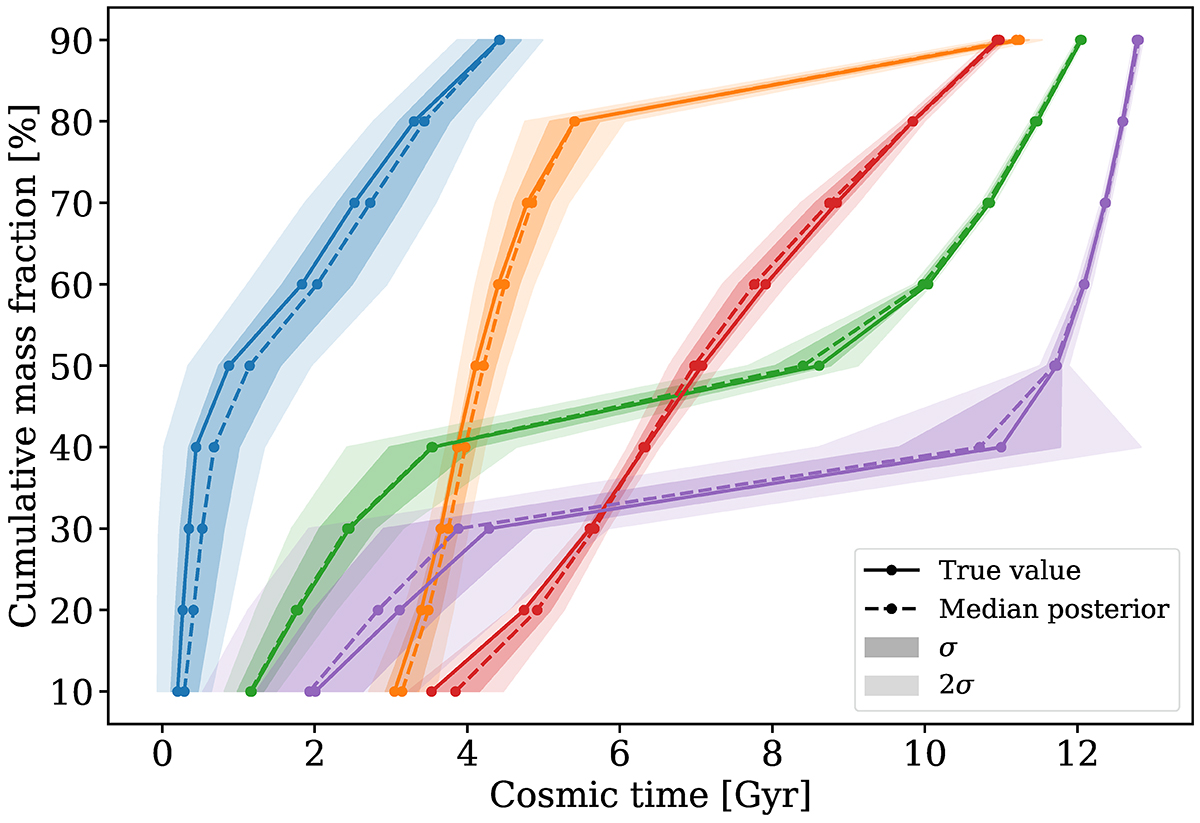
Fig. 2.
Download original image
Percentile predictions for five synthetic galaxies. The cumulative mass curves indicate the time at which the nine stellar mass percentiles are achieved over cosmic time. The solid lines correspond to the true values, and the dashed ones to the predictions (medians of the posterior distributions). The σ and 2σ intervals of confidence are shaded dark and light, respectively. The model yields reliable reconstructions for all five galaxies.
Current usage metrics show cumulative count of Article Views (full-text article views including HTML views, PDF and ePub downloads, according to the available data) and Abstracts Views on Vision4Press platform.
Data correspond to usage on the plateform after 2015. The current usage metrics is available 48-96 hours after online publication and is updated daily on week days.
Initial download of the metrics may take a while.