Fig. 7.
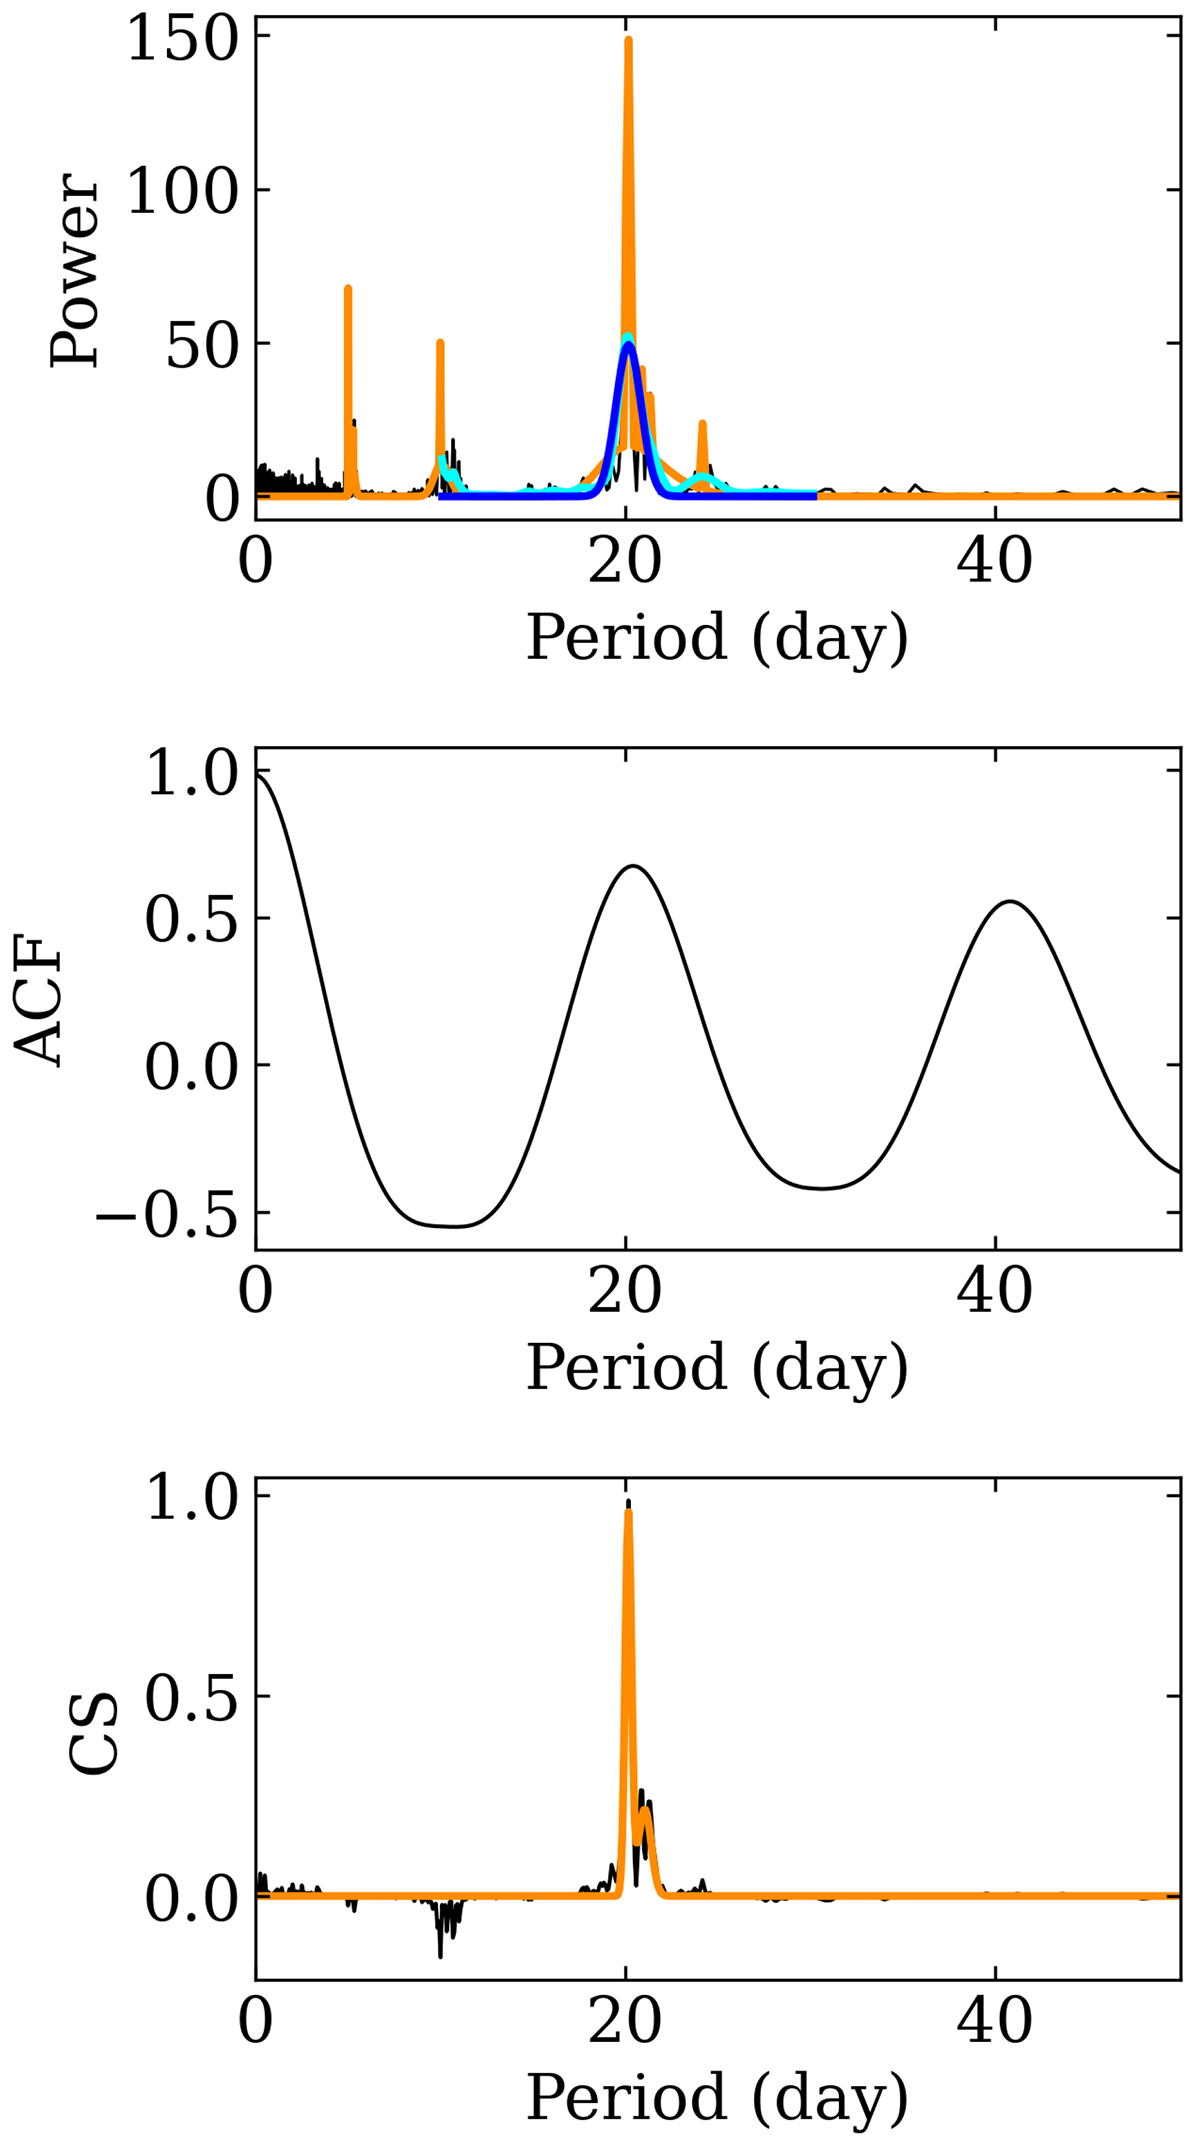
Download original image
Example of GLS periodogram (top), ACF (middle), and CS (bottom) analyses performed to recover the rotational modulation of the light curve shown in Fig. 4, using the full time series. The GLS periodogram was normalised to account for the background contribution according to the method described in Sect. 2.2.1. The set of Gaussian profiles fitted on the GLS periodogram and the CS are shown in orange. The smoothed periodogram is shown in cyan, while the Gaussian profile fitted on it and centred on PLS is shown in blue.
Current usage metrics show cumulative count of Article Views (full-text article views including HTML views, PDF and ePub downloads, according to the available data) and Abstracts Views on Vision4Press platform.
Data correspond to usage on the plateform after 2015. The current usage metrics is available 48-96 hours after online publication and is updated daily on week days.
Initial download of the metrics may take a while.