Fig. 4.
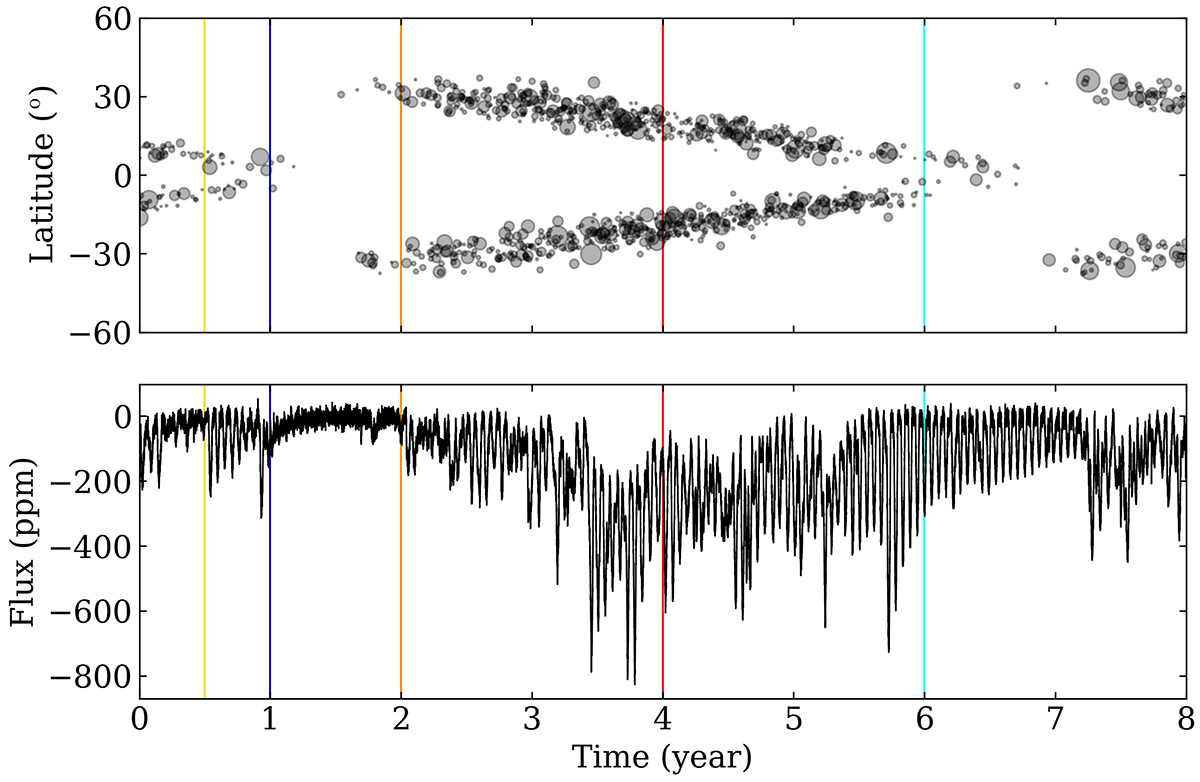
Download original image
Example of spot activity included in the simulations (top) and the corresponding 8 year light curve, including convective granulation (bottom). The simulation has Prot = 21 days, Pcycle = 5.4 years, δcycle = 0.45 years, and i = 83°. The vertical coloured lines highlight the extent of the light-curve segments considered in this work in addition to the full 8 year light curves: 6 months (yellow), 1 year (blue), 2 years (orange), 4 years (red), and 6 years (cyan).
Current usage metrics show cumulative count of Article Views (full-text article views including HTML views, PDF and ePub downloads, according to the available data) and Abstracts Views on Vision4Press platform.
Data correspond to usage on the plateform after 2015. The current usage metrics is available 48-96 hours after online publication and is updated daily on week days.
Initial download of the metrics may take a while.