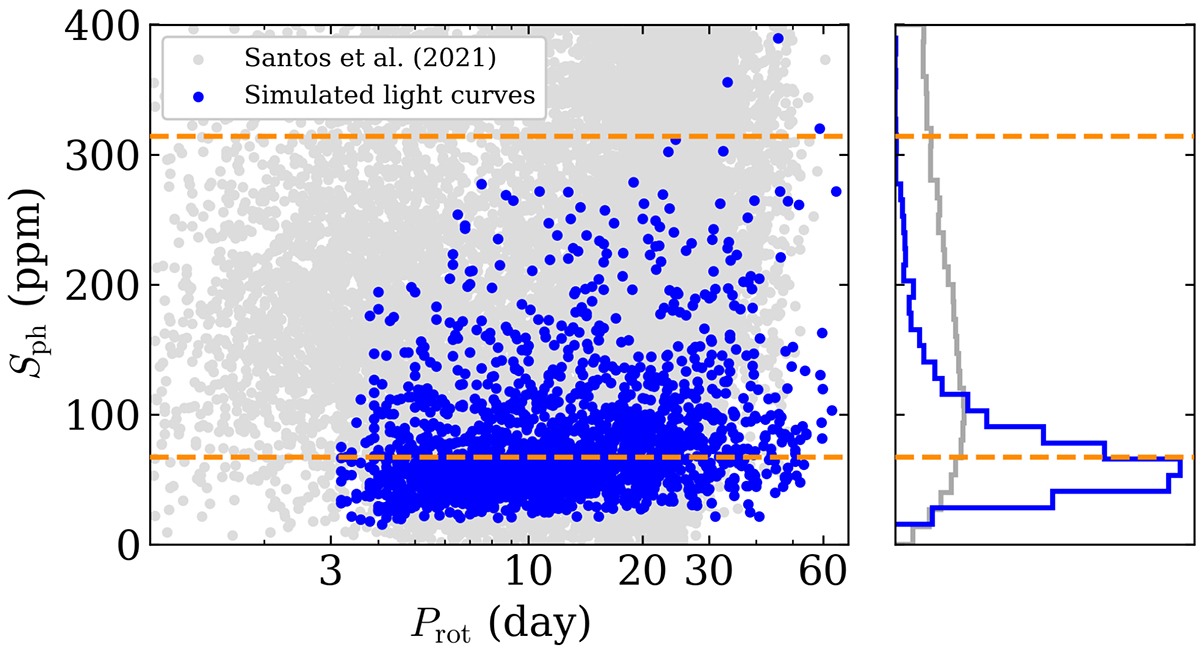
Fig. 3.
Download original image
Rotation period Prot and activity index Sph distribution of the simulated sample (blue) compared with the sample from Santos et al. (2021a, grey). The right panel shows the projected Sph density distribution for the two populations. The projected density distribution for the Santos et al. (2021a) targets is computed considering only stars with Sph < 400 ppm. The dashed horizontal orange lines correspond to the solar minimal and maximal values measured by Salabert et al. (2016).
Current usage metrics show cumulative count of Article Views (full-text article views including HTML views, PDF and ePub downloads, according to the available data) and Abstracts Views on Vision4Press platform.
Data correspond to usage on the plateform after 2015. The current usage metrics is available 48-96 hours after online publication and is updated daily on week days.
Initial download of the metrics may take a while.