Fig. B.1.
Download original image
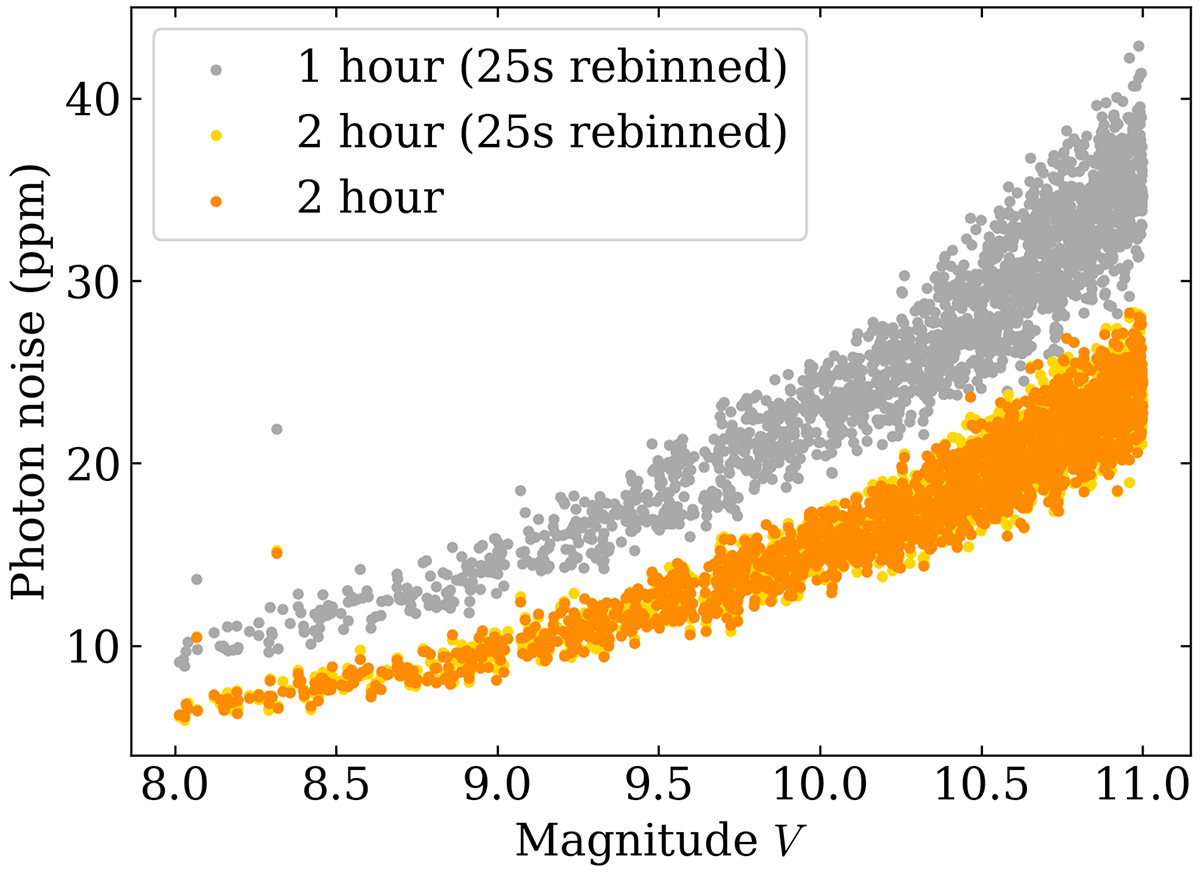
Photon noise level as a function of magnitude V. The orange distribution corresponds to photon noise level computed for pure noise time series generated directly with a 2-hour sampling. The yellow distribution corresponds to photon noise level computed for pure noise time series generated with a 25s sampling, rebinned at 2-hour. The grey distribution corresponds to photon noise level computed for pure noise time series generated with a 25s sampling, rebinned at 1-hour.
Current usage metrics show cumulative count of Article Views (full-text article views including HTML views, PDF and ePub downloads, according to the available data) and Abstracts Views on Vision4Press platform.
Data correspond to usage on the plateform after 2015. The current usage metrics is available 48-96 hours after online publication and is updated daily on week days.
Initial download of the metrics may take a while.