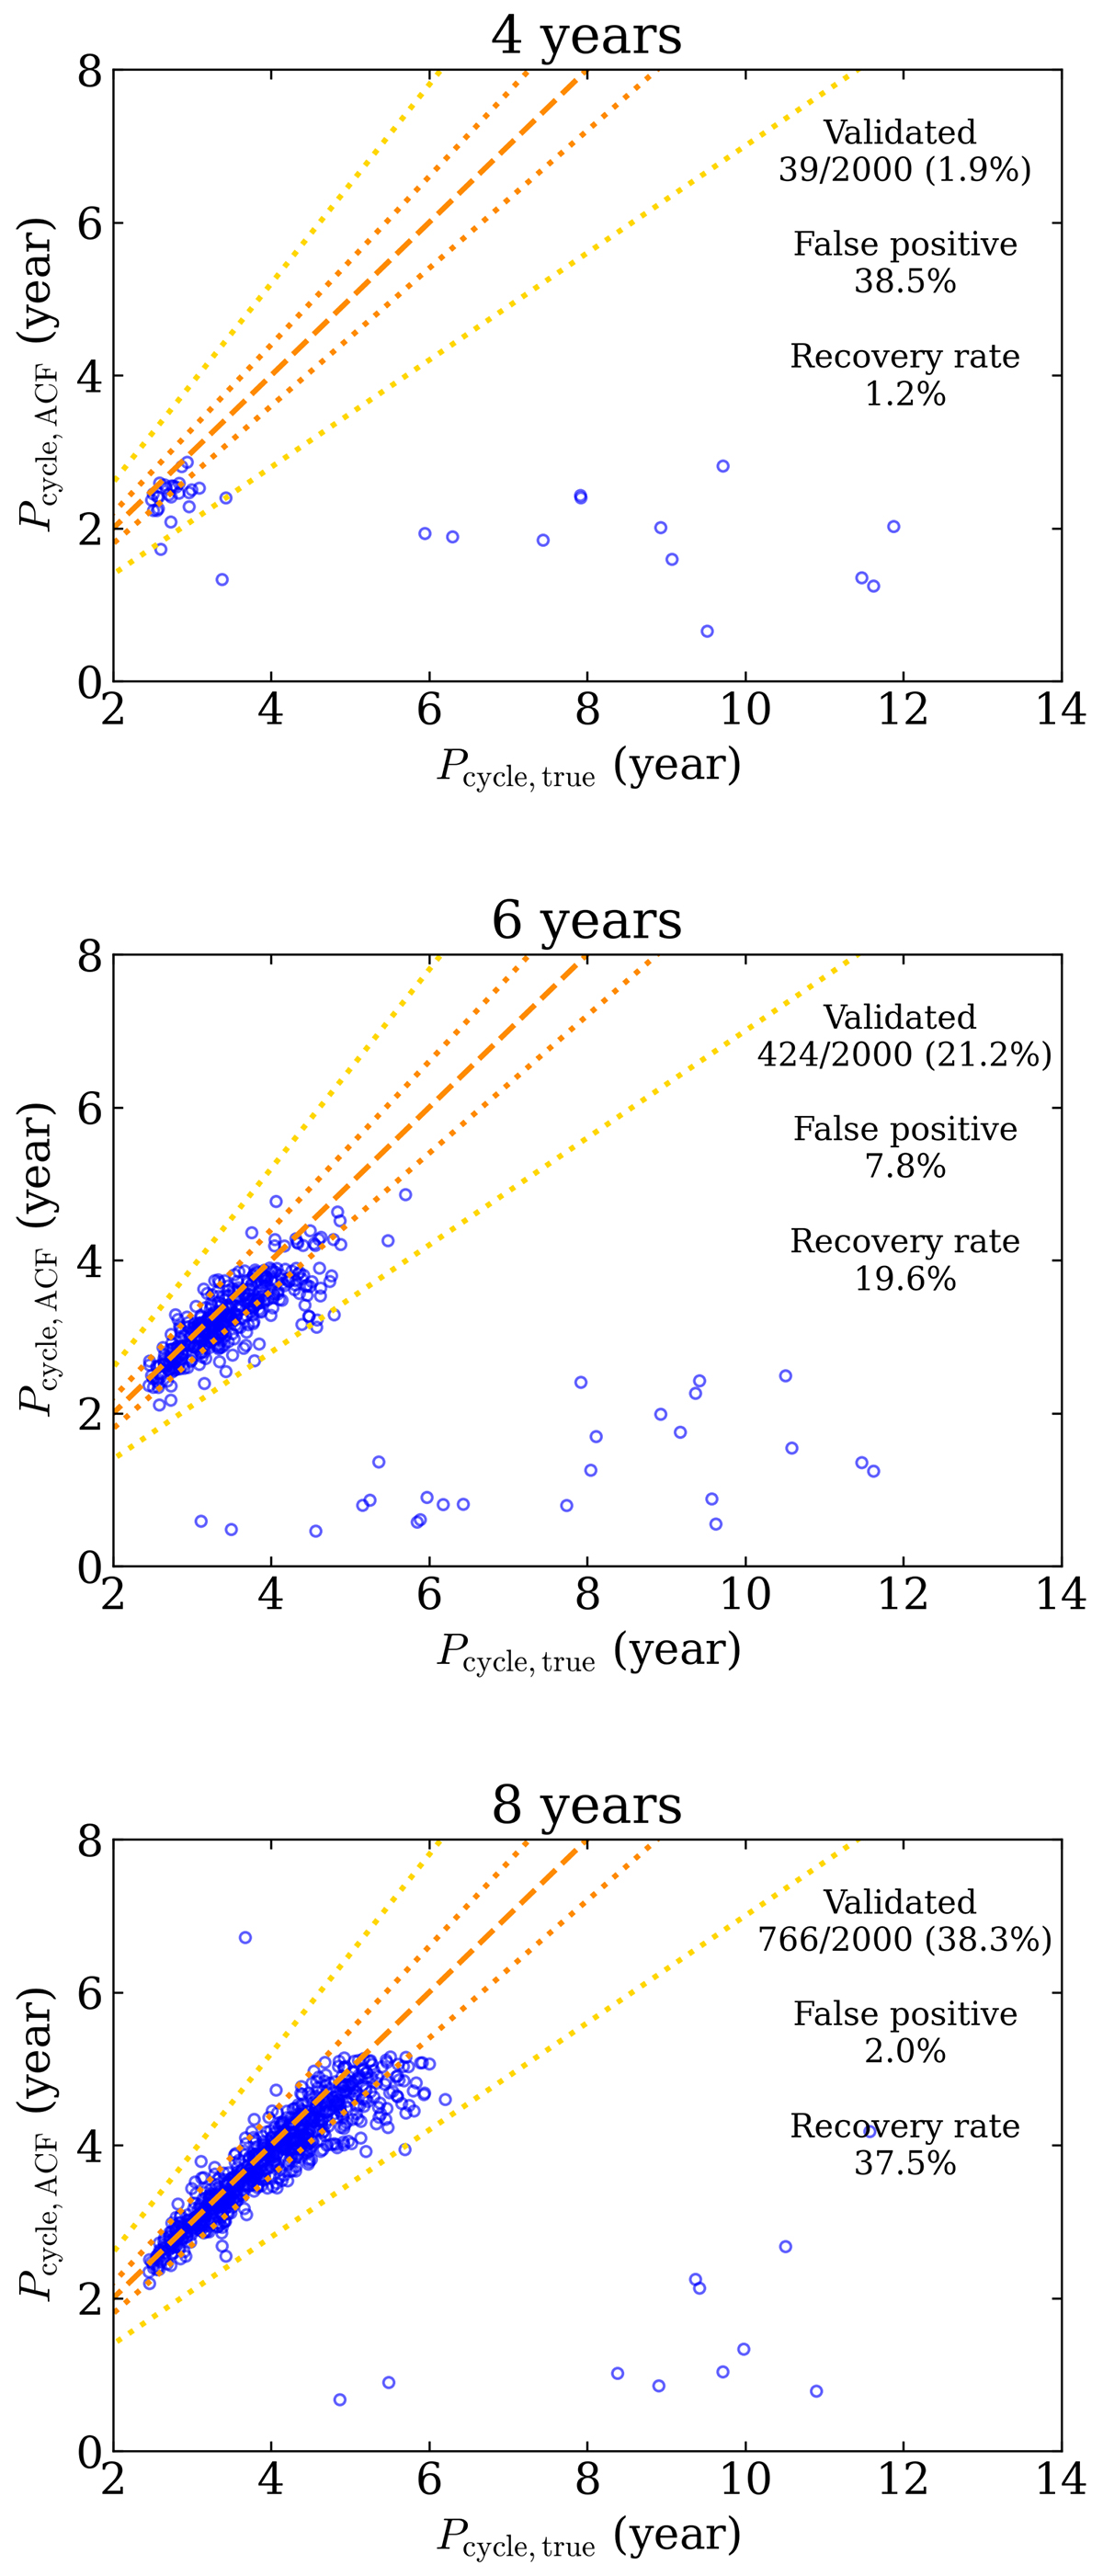
Fig. 10.
Download original image
Measured long-term modulations (blue) compared to the cycle length included in the simulations in the case of noise-free light curves for the temporal baselines considered in this work, where we retrieve modulations: 4 years (top), 6 years (middle), and 8 years (bottom). The dashed orange line corresponds to the 1:1 line, while the upper dotted orange line and the lower dotted orange line are the 1:1.1 and 1:0.9 lines, respectively. The upper dotted yellow line and the lower dotted yellow line are the 1:1.3 and 1:0.7 lines, respectively.
Current usage metrics show cumulative count of Article Views (full-text article views including HTML views, PDF and ePub downloads, according to the available data) and Abstracts Views on Vision4Press platform.
Data correspond to usage on the plateform after 2015. The current usage metrics is available 48-96 hours after online publication and is updated daily on week days.
Initial download of the metrics may take a while.