Fig. 4
Download original image
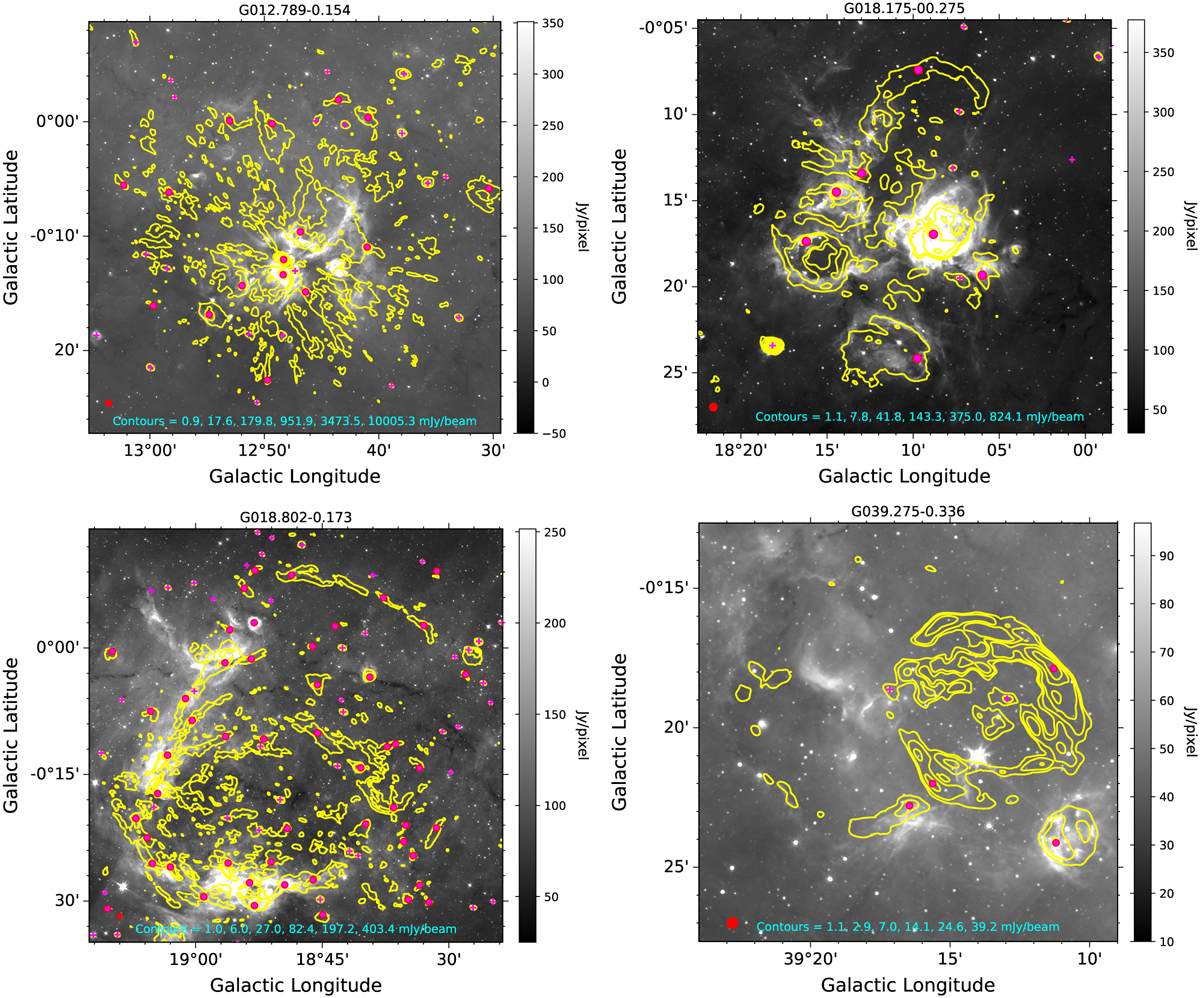
Examples of radio emission associated with large-scale structures. The grayscale background represents GLIMPSE 8 μm emission, while the yellow contours are the GLOSTAR 5.8 GHz radio continuum emission. These regions often show coherent infrared structures that are morphologically correlated with most of the radio emission (see examples presented in the upper panels). Although this correlation is not always present, the different radio emission blobs are clearly related with each other (see examples presented in the lower panels). The contours are determined as described in the figures, and the red-filled circle shown in the lower left corners shows the GLOSTAR VLA D-configuration beam FWHM. The magenta-filled circles indicate the peak positions of radio sources associated with these regions, and magenta crosses indicate compact radio sources in the area that are treated as separate sources.
Current usage metrics show cumulative count of Article Views (full-text article views including HTML views, PDF and ePub downloads, according to the available data) and Abstracts Views on Vision4Press platform.
Data correspond to usage on the plateform after 2015. The current usage metrics is available 48-96 hours after online publication and is updated daily on week days.
Initial download of the metrics may take a while.