Open Access
Fig. 17
Download original image
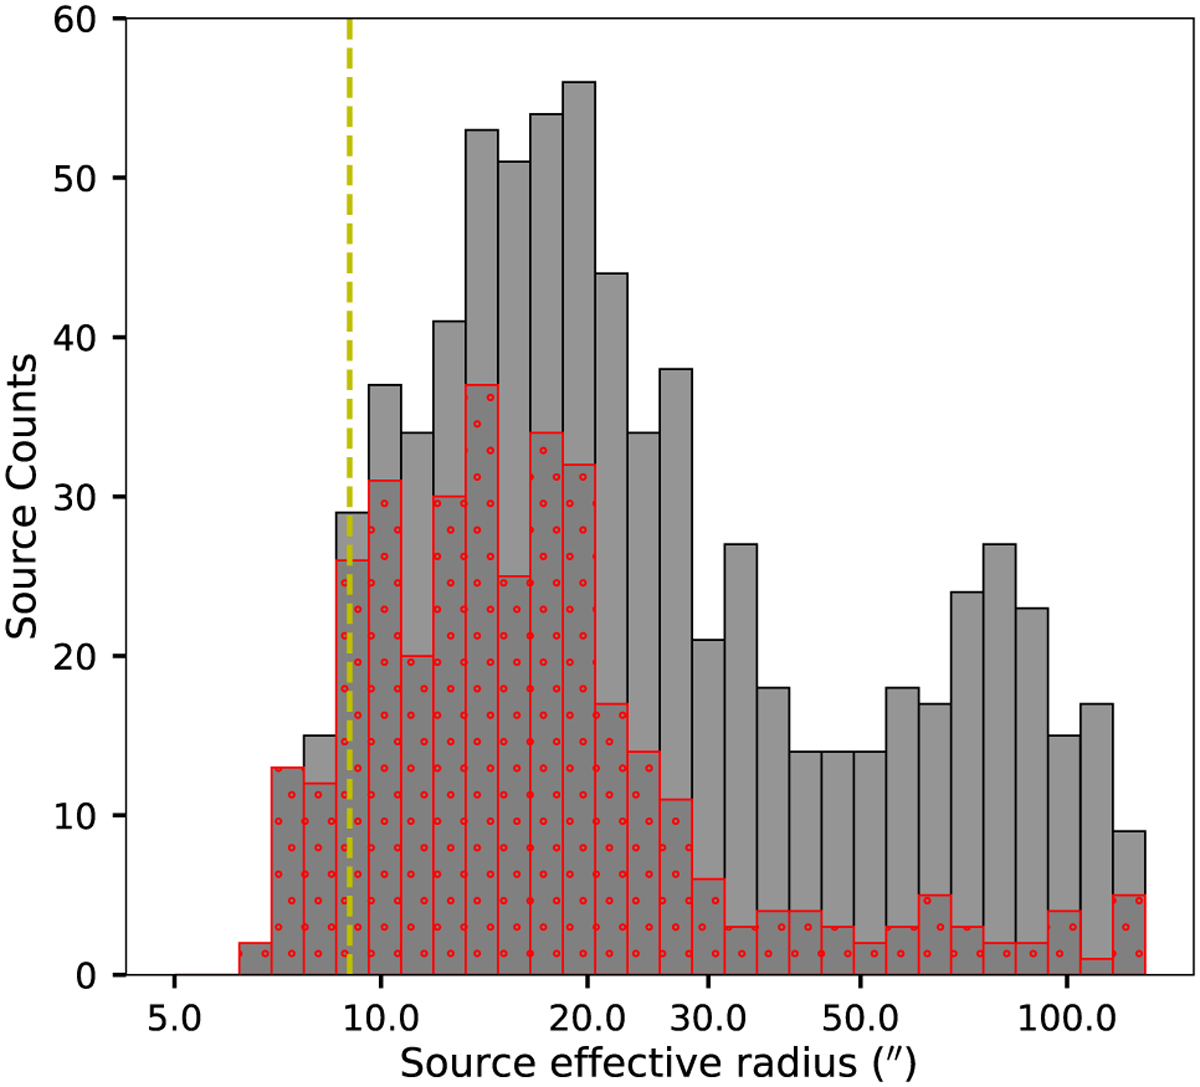
Distribution of H II region effective radius. The gray bars show the distribution for all identified H II regions. Red bars are the new H II regions candidates identified in this work. The dashed yellow line indicates the resolution of the observation (radius of the synthesized beam). The bin size used is 0.05 dex.
Current usage metrics show cumulative count of Article Views (full-text article views including HTML views, PDF and ePub downloads, according to the available data) and Abstracts Views on Vision4Press platform.
Data correspond to usage on the plateform after 2015. The current usage metrics is available 48-96 hours after online publication and is updated daily on week days.
Initial download of the metrics may take a while.