Open Access
Fig. 16
Download original image
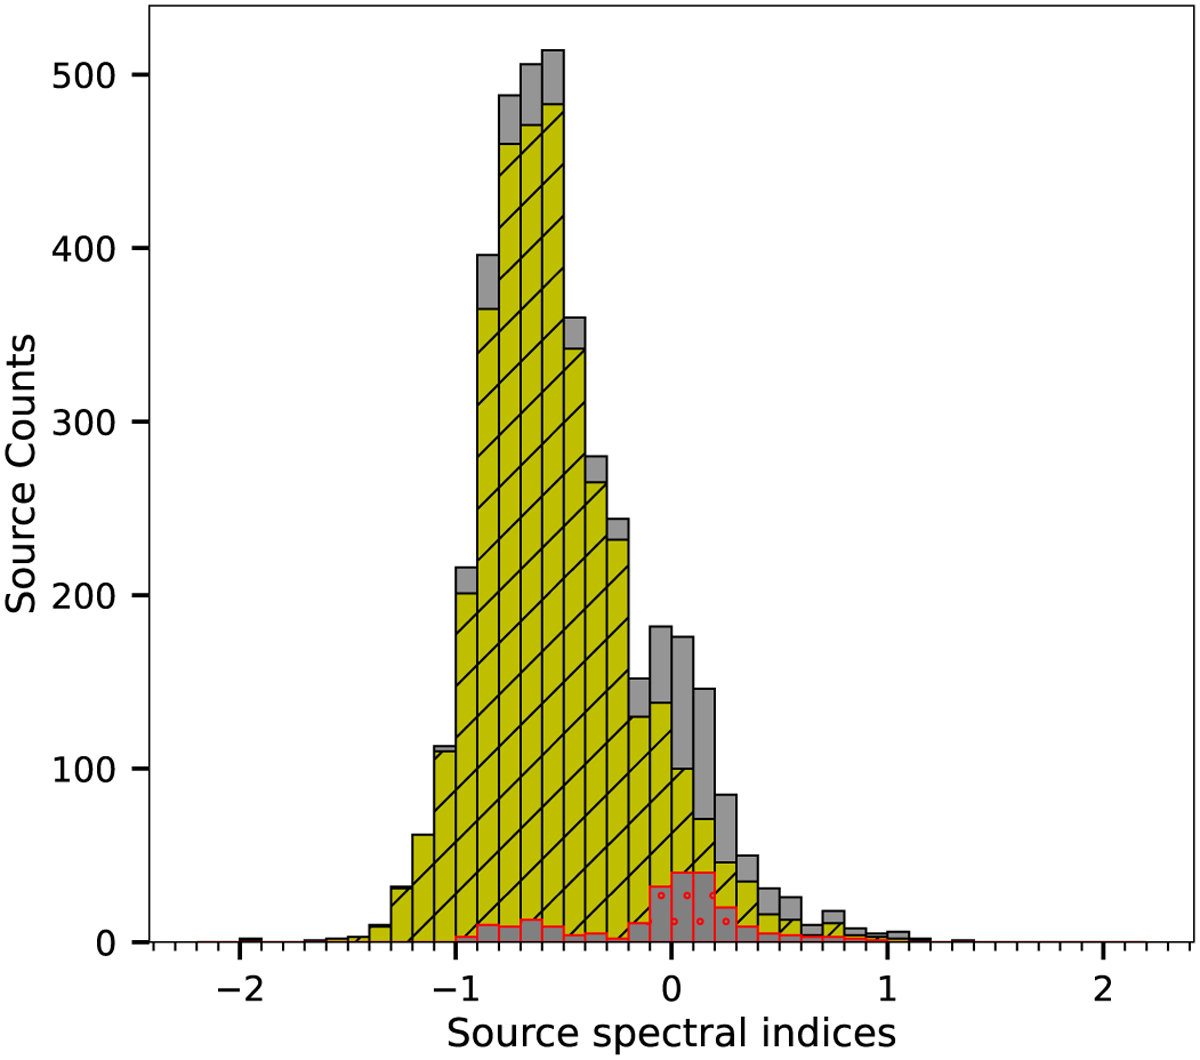
GLOSTAR-THOR spectral index distribution of radio sources reported in this work. In gray is the full sample, yellow is for sources related to EgC and red for H II region candidates. The histogram used a bin size of 0.1.
Current usage metrics show cumulative count of Article Views (full-text article views including HTML views, PDF and ePub downloads, according to the available data) and Abstracts Views on Vision4Press platform.
Data correspond to usage on the plateform after 2015. The current usage metrics is available 48-96 hours after online publication and is updated daily on week days.
Initial download of the metrics may take a while.