Fig. 15
Download original image
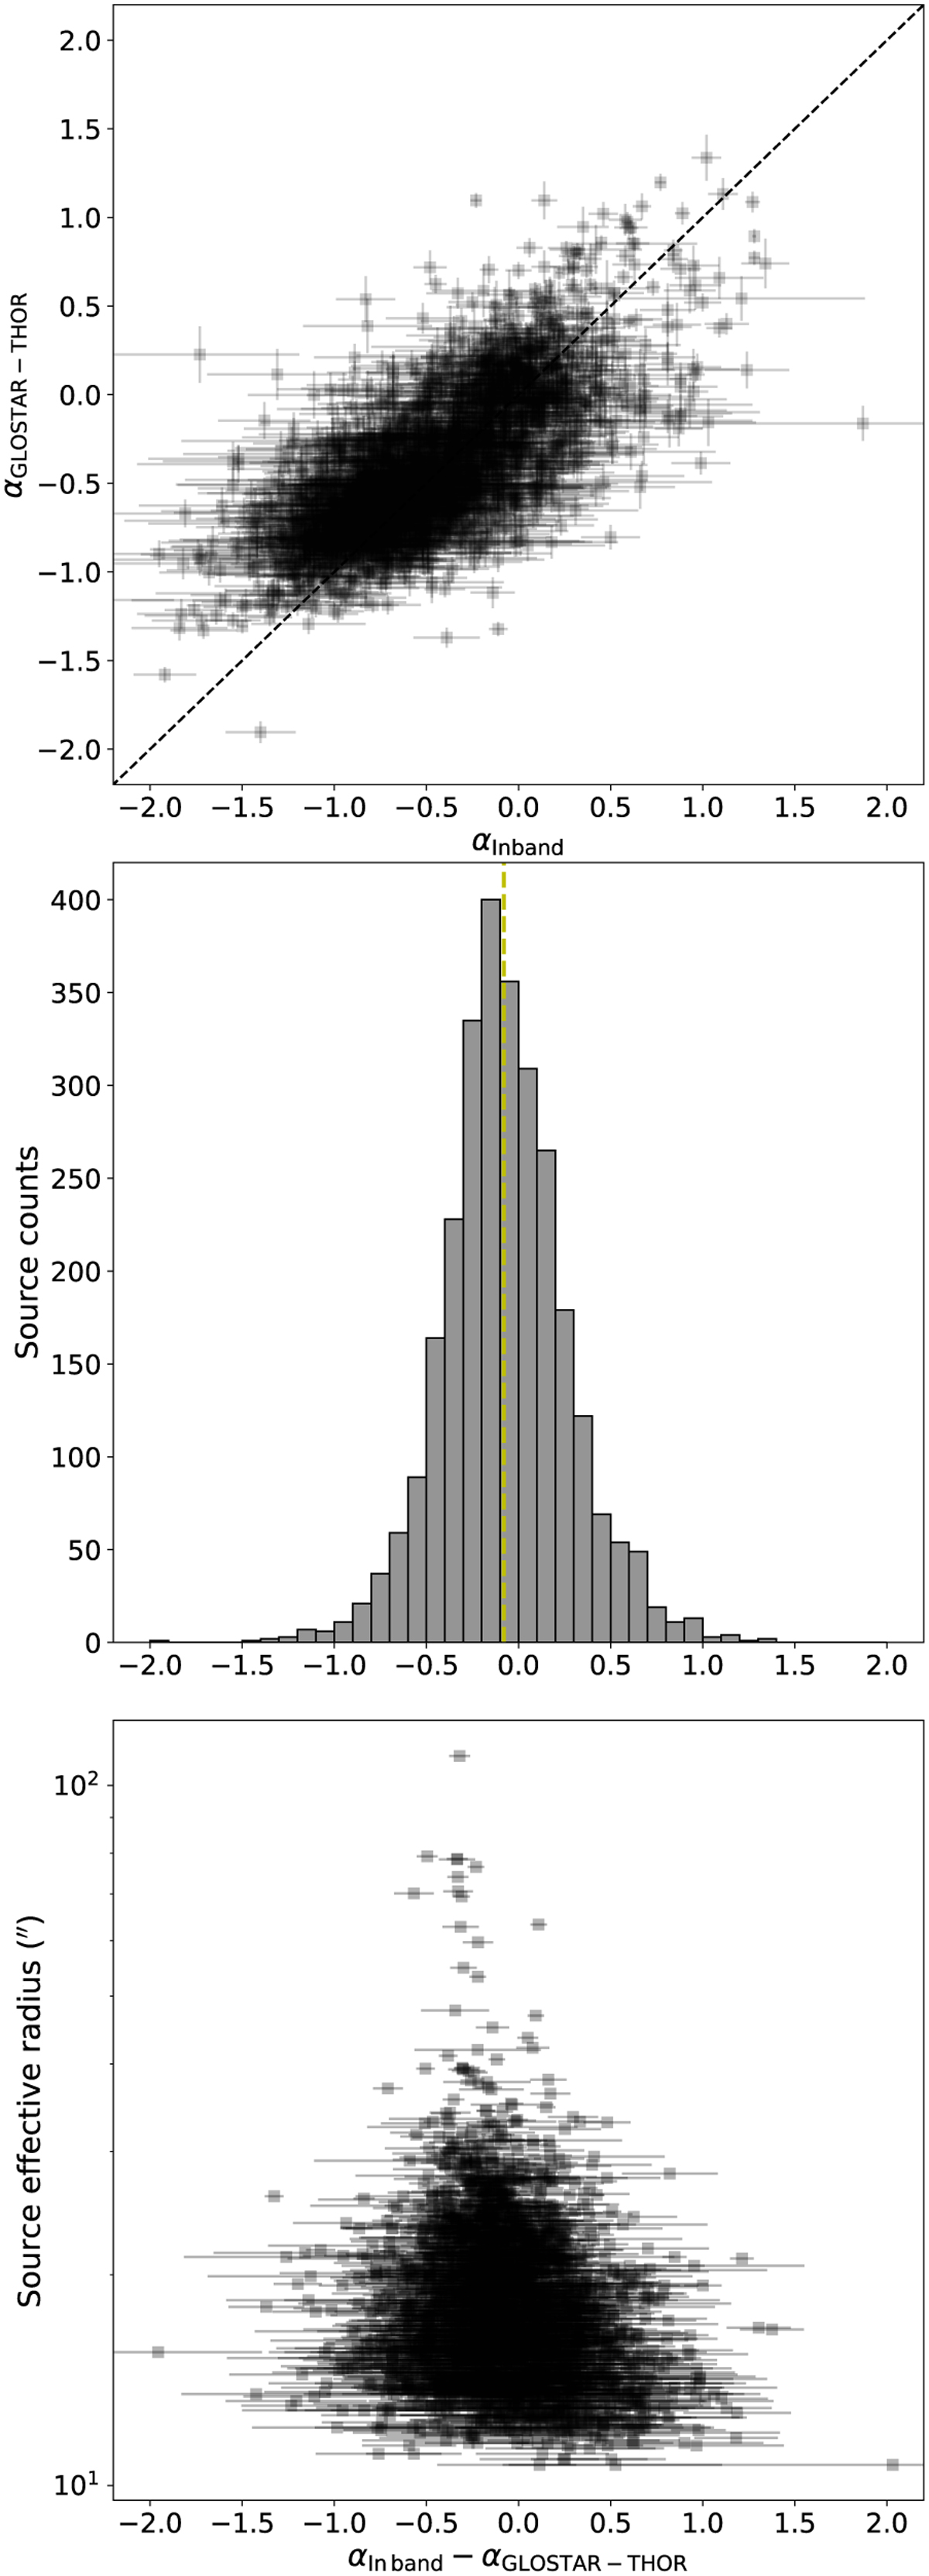
Comparison of GLOSTAR in-band and GLOSTAR-THOR spectral indices. Top: scatter plot of αInband vs. αGLOSTAR-THOR. The dashed black line is the equality line. Middle: Distribution of the differences of the spectral indices. The dashed yellow line indicates the mean value of −0.08 ± 0.01. The standard deviation is 0.35. The histogram used a bin size of 0.1. Bottom: source effective radius vs. αInband − αGLOSTAR-THOR.
Current usage metrics show cumulative count of Article Views (full-text article views including HTML views, PDF and ePub downloads, according to the available data) and Abstracts Views on Vision4Press platform.
Data correspond to usage on the plateform after 2015. The current usage metrics is available 48-96 hours after online publication and is updated daily on week days.
Initial download of the metrics may take a while.