Fig. 12
Download original image
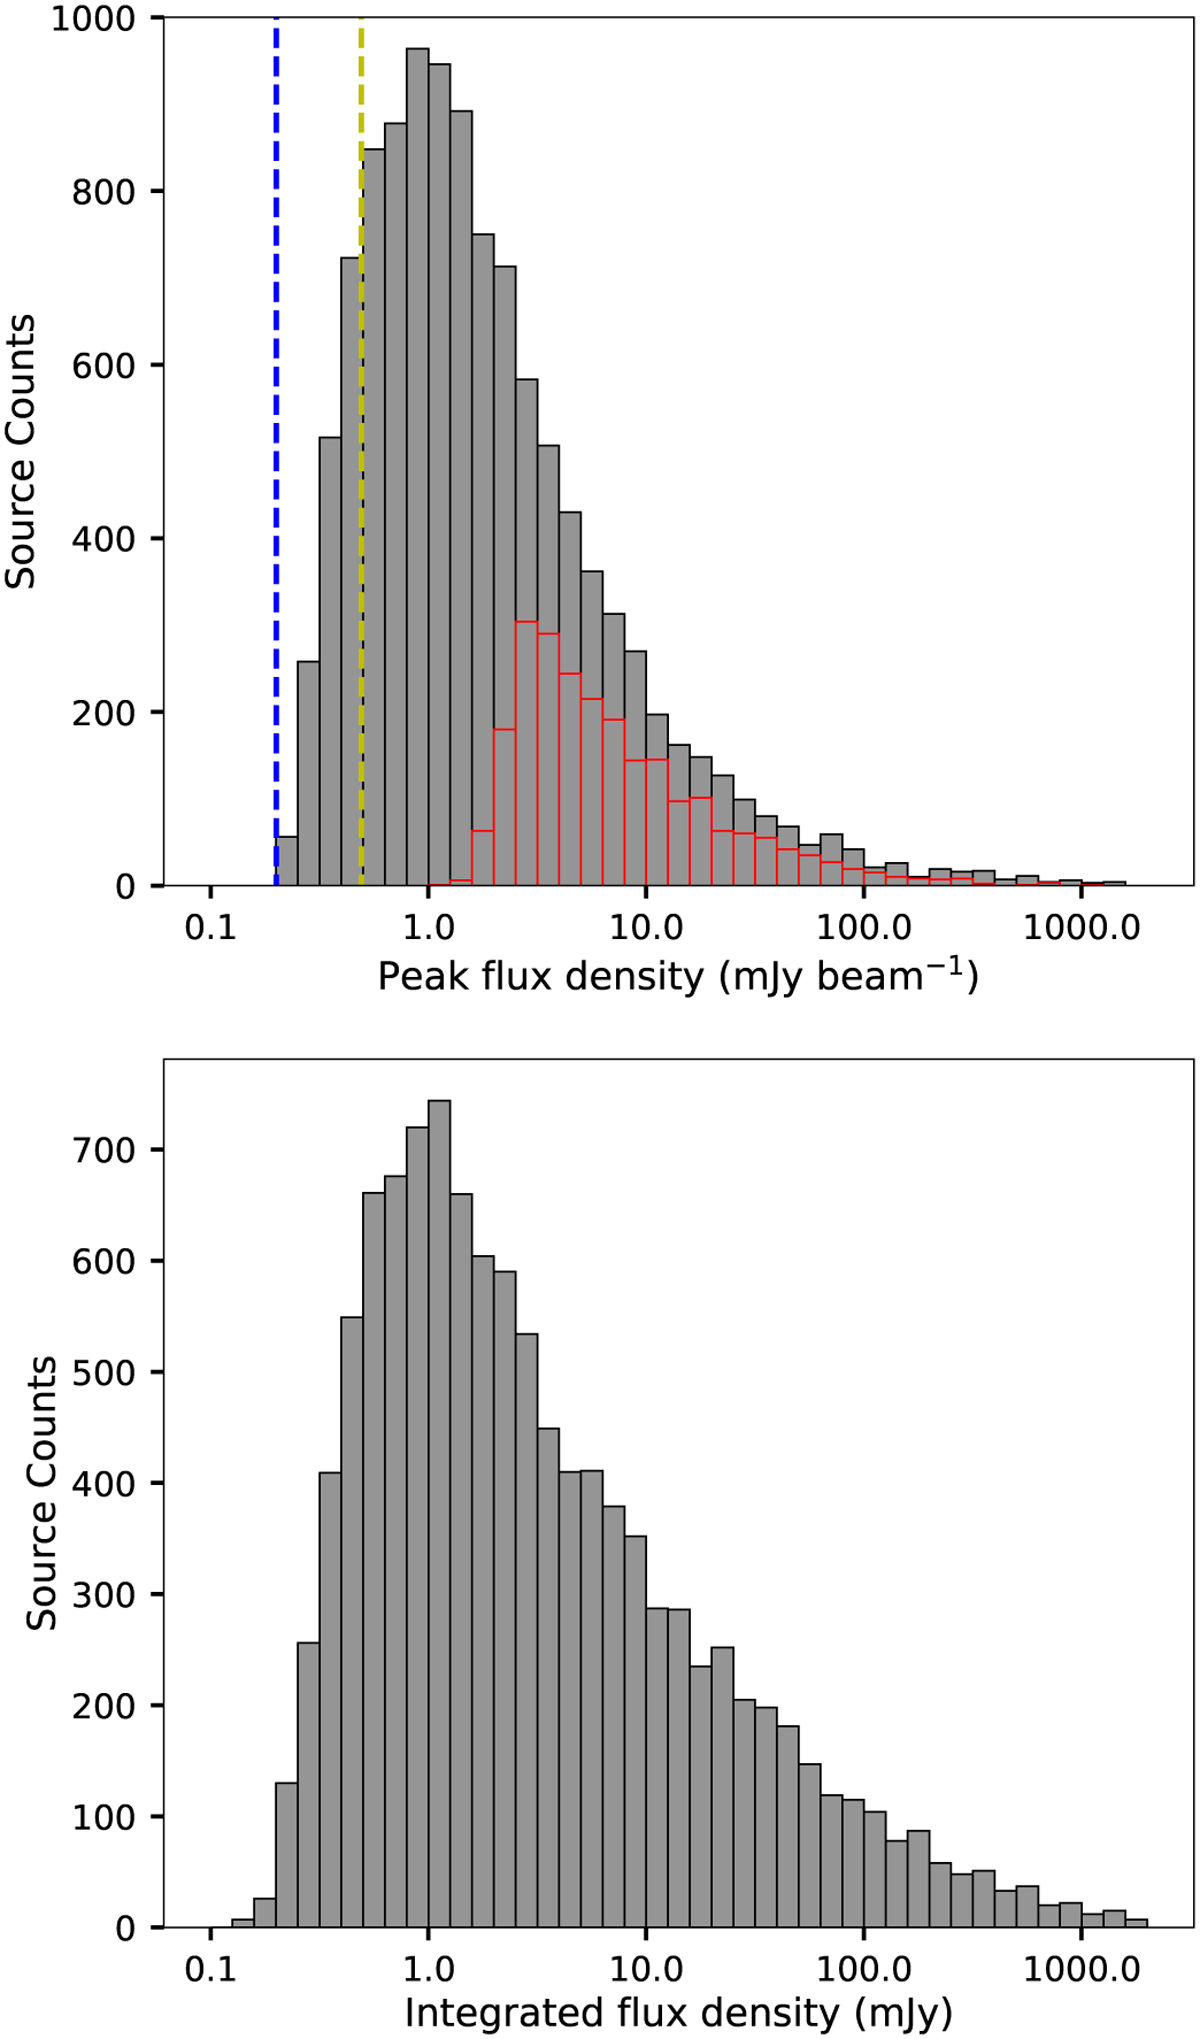
Peak (top) and integrated (bottom) flux distribution of GLOSTAR sources. The dashed blue and yellow lines in the upper panel delimit the 4σnoise detection limit in areas free of extended emission (σnoise ≃ 50μJy beam−1) and for the nominal noise level of the D-configuration images (σnoise ≃ 123μJy beam−1). The red histogram in the upper panel shows the flux distribution of sources previously identified by CORNISH. The bin width is 0.1 dex.
Current usage metrics show cumulative count of Article Views (full-text article views including HTML views, PDF and ePub downloads, according to the available data) and Abstracts Views on Vision4Press platform.
Data correspond to usage on the plateform after 2015. The current usage metrics is available 48-96 hours after online publication and is updated daily on week days.
Initial download of the metrics may take a while.