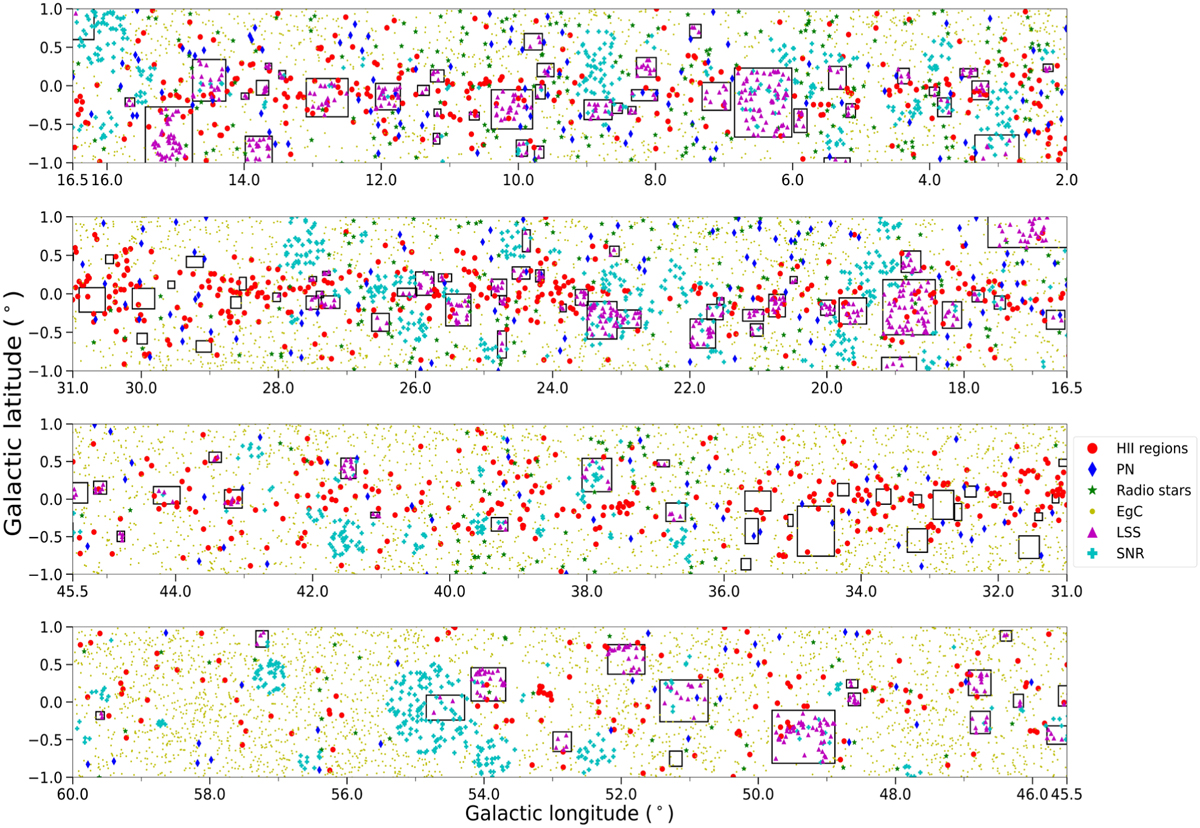
Fig. 11
Download original image
Spatial distribution of GLOSTAR radio sources reported in this work. Different markers are used for the different resulting source classifications and are labeled on the right side of the plot. Squares delimit the area of the LSSs also identified in this work (see Sect. 3.2). Sources in the range 28° < ℓ < 36° are taken from Medina et al. (2019).
Current usage metrics show cumulative count of Article Views (full-text article views including HTML views, PDF and ePub downloads, according to the available data) and Abstracts Views on Vision4Press platform.
Data correspond to usage on the plateform after 2015. The current usage metrics is available 48-96 hours after online publication and is updated daily on week days.
Initial download of the metrics may take a while.