Open Access
Fig. 5.
Download original image
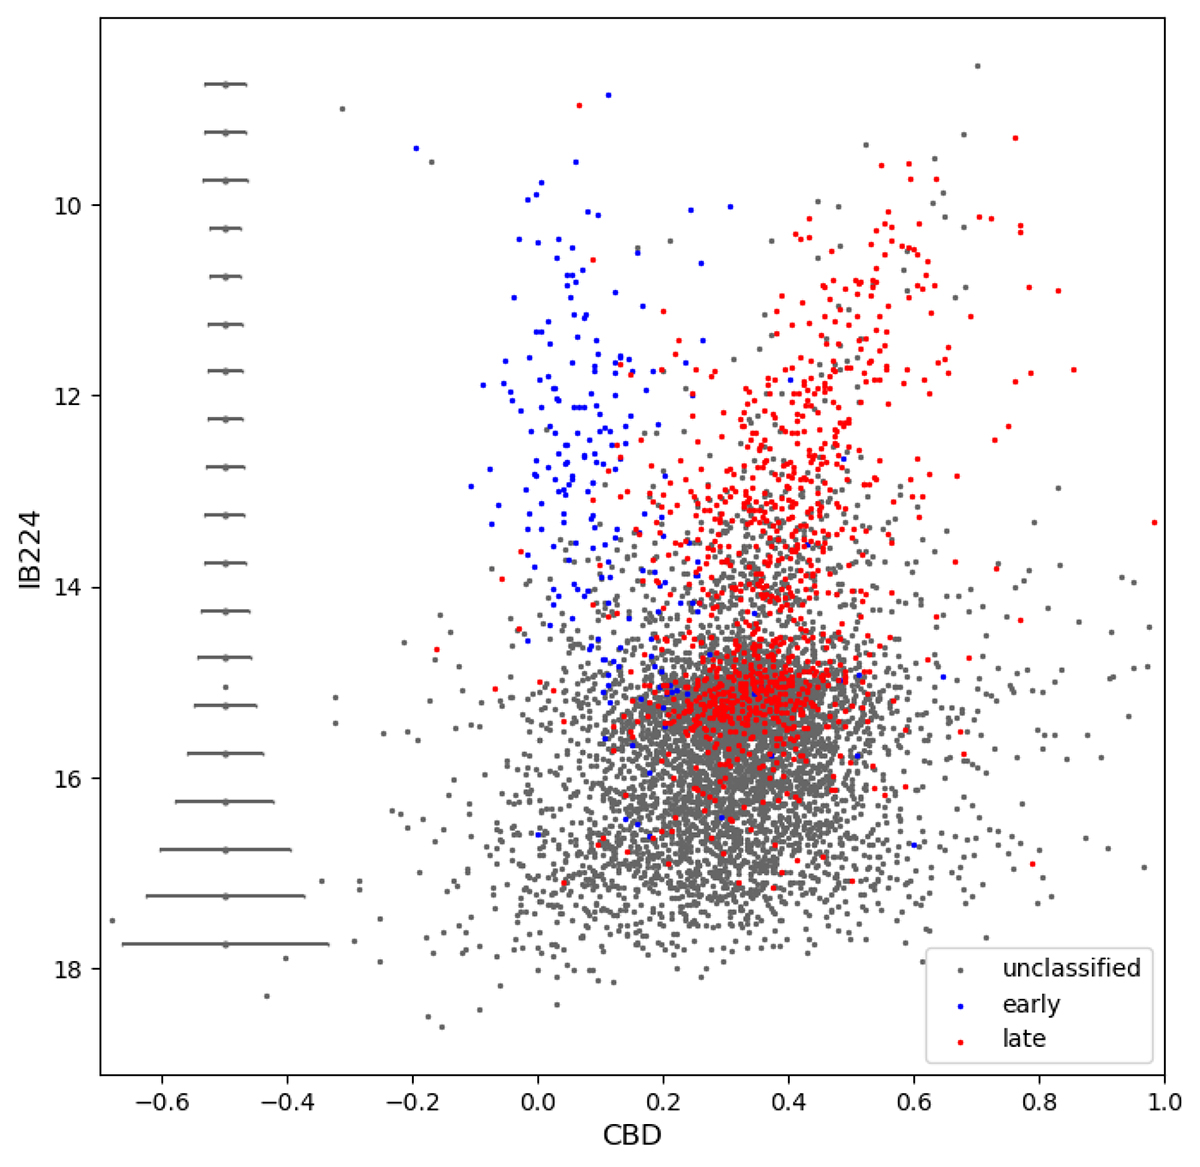
CBD diagram for the entire sample. The median errors of the CBD for bins of 0.5 mag are represented by grey bars on the left side of the panel. The spectroscopically classified stars are marked by blue (early-type) and red (late-type) points.
Current usage metrics show cumulative count of Article Views (full-text article views including HTML views, PDF and ePub downloads, according to the available data) and Abstracts Views on Vision4Press platform.
Data correspond to usage on the plateform after 2015. The current usage metrics is available 48-96 hours after online publication and is updated daily on week days.
Initial download of the metrics may take a while.