Open Access
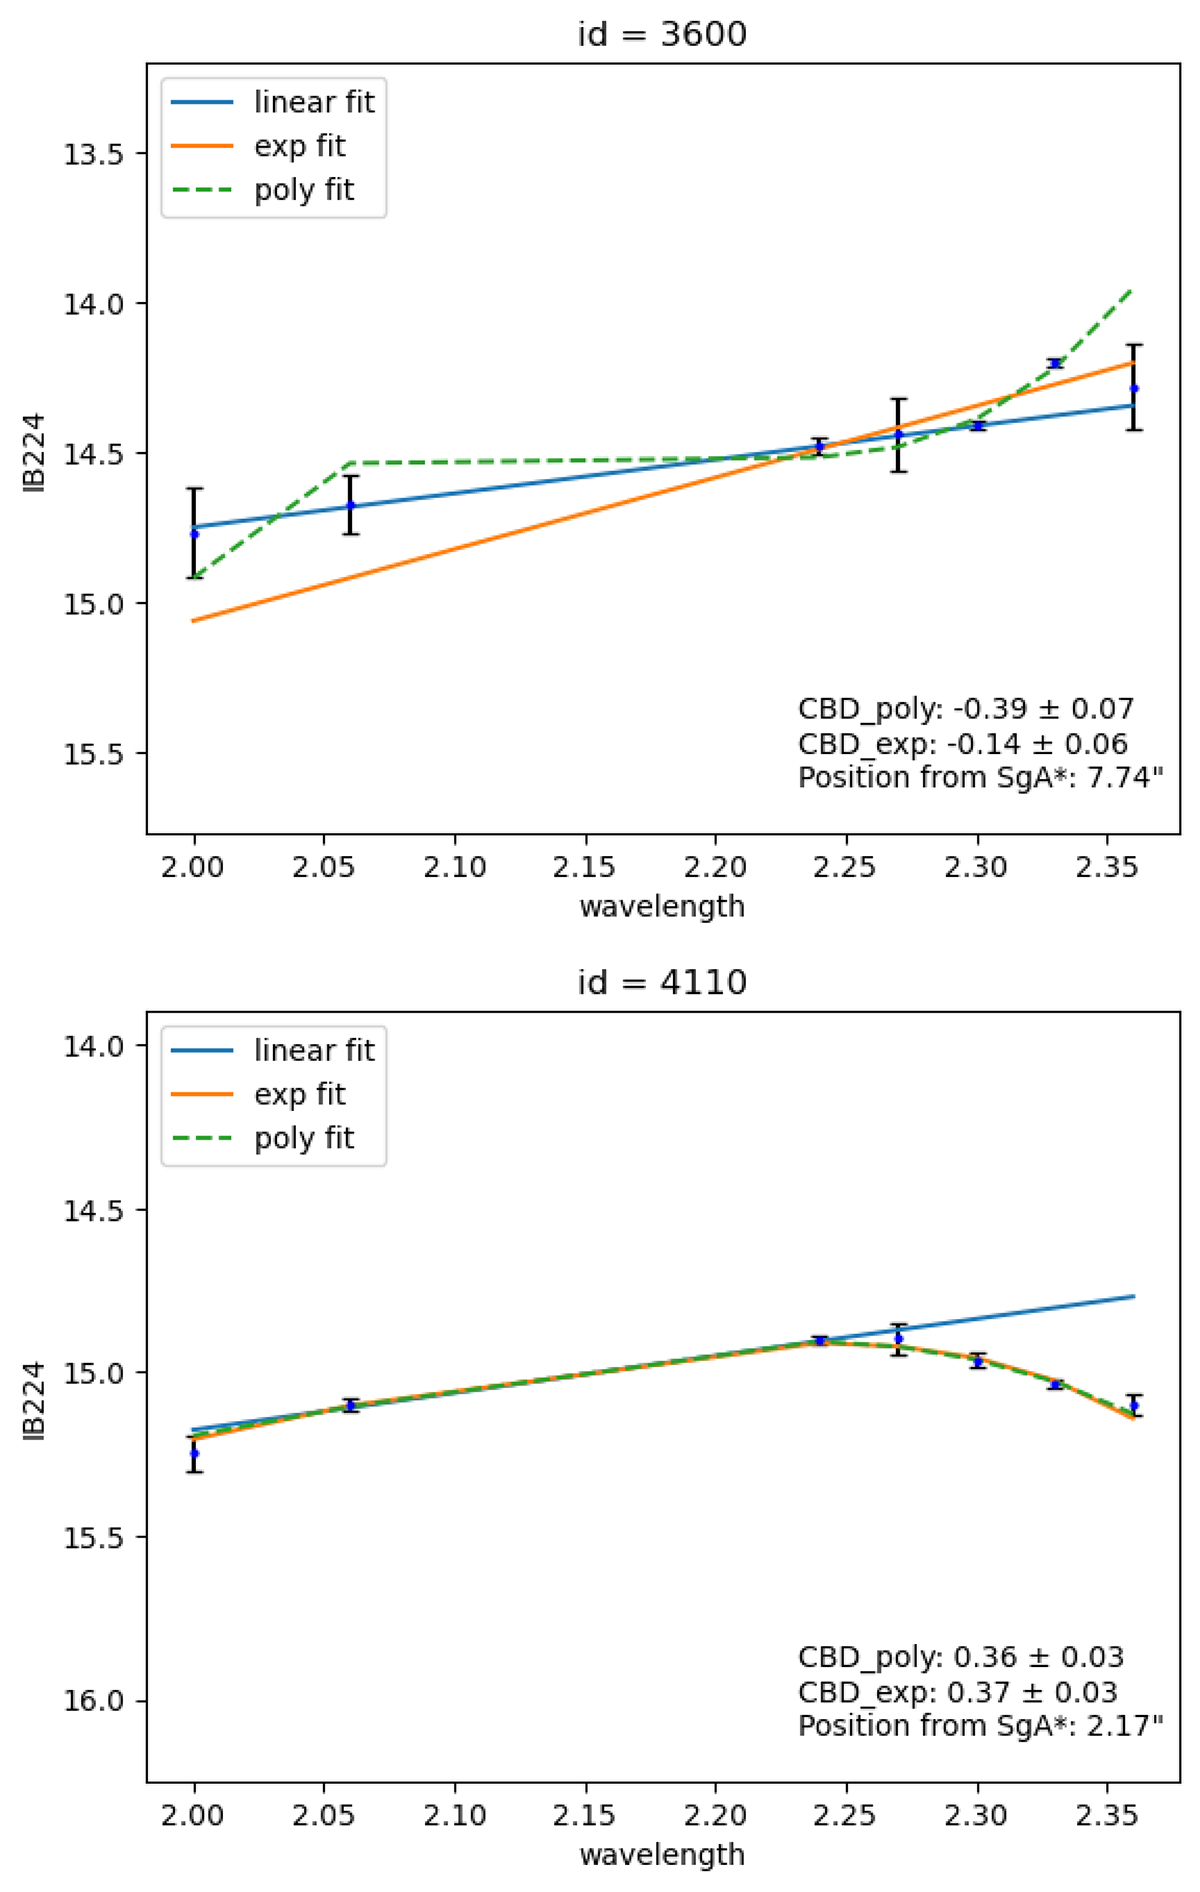
Fig. D.2.
Download original image
SEDs of two stars. The blue line denotes the linear fit to the first data points, the orange line represents the exponential fit, and the green line the polynomial fit to all seven points, respectively. The values of the CBD are annotated in the panels for the two fits.
Current usage metrics show cumulative count of Article Views (full-text article views including HTML views, PDF and ePub downloads, according to the available data) and Abstracts Views on Vision4Press platform.
Data correspond to usage on the plateform after 2015. The current usage metrics is available 48-96 hours after online publication and is updated daily on week days.
Initial download of the metrics may take a while.