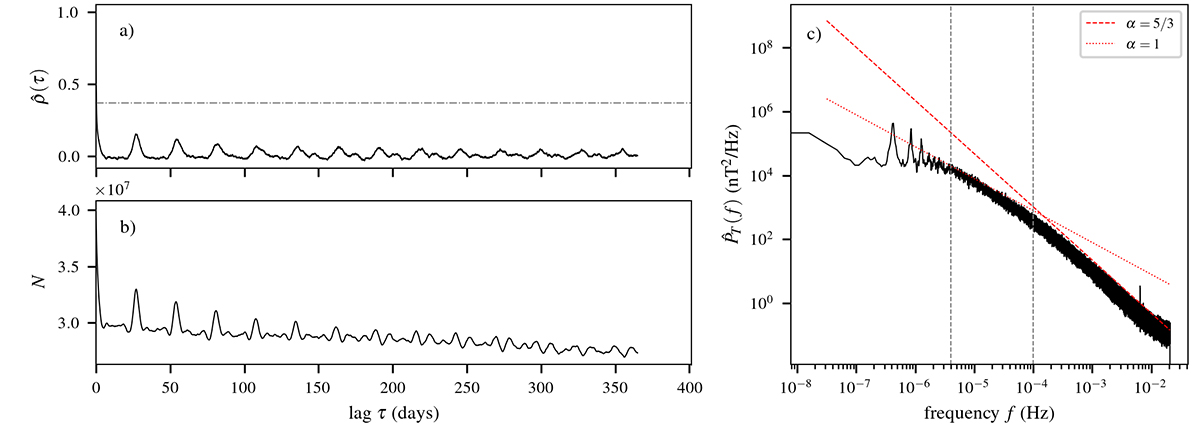
Fig. 7.
Download original image
Estimations of the PSD and ACF of the slow wind at 1 AU as found using conditioned Wind data. The panels have the same quantities and format as Figure 2. The dashed red lines the expected power laws for the inertial and 1/f ranges, shown for the sake of comparison. The vertical gray dashed lines show the approximate locations of the spectral breaks on both sides of the 1/f range.
Current usage metrics show cumulative count of Article Views (full-text article views including HTML views, PDF and ePub downloads, according to the available data) and Abstracts Views on Vision4Press platform.
Data correspond to usage on the plateform after 2015. The current usage metrics is available 48-96 hours after online publication and is updated daily on week days.
Initial download of the metrics may take a while.