Open Access
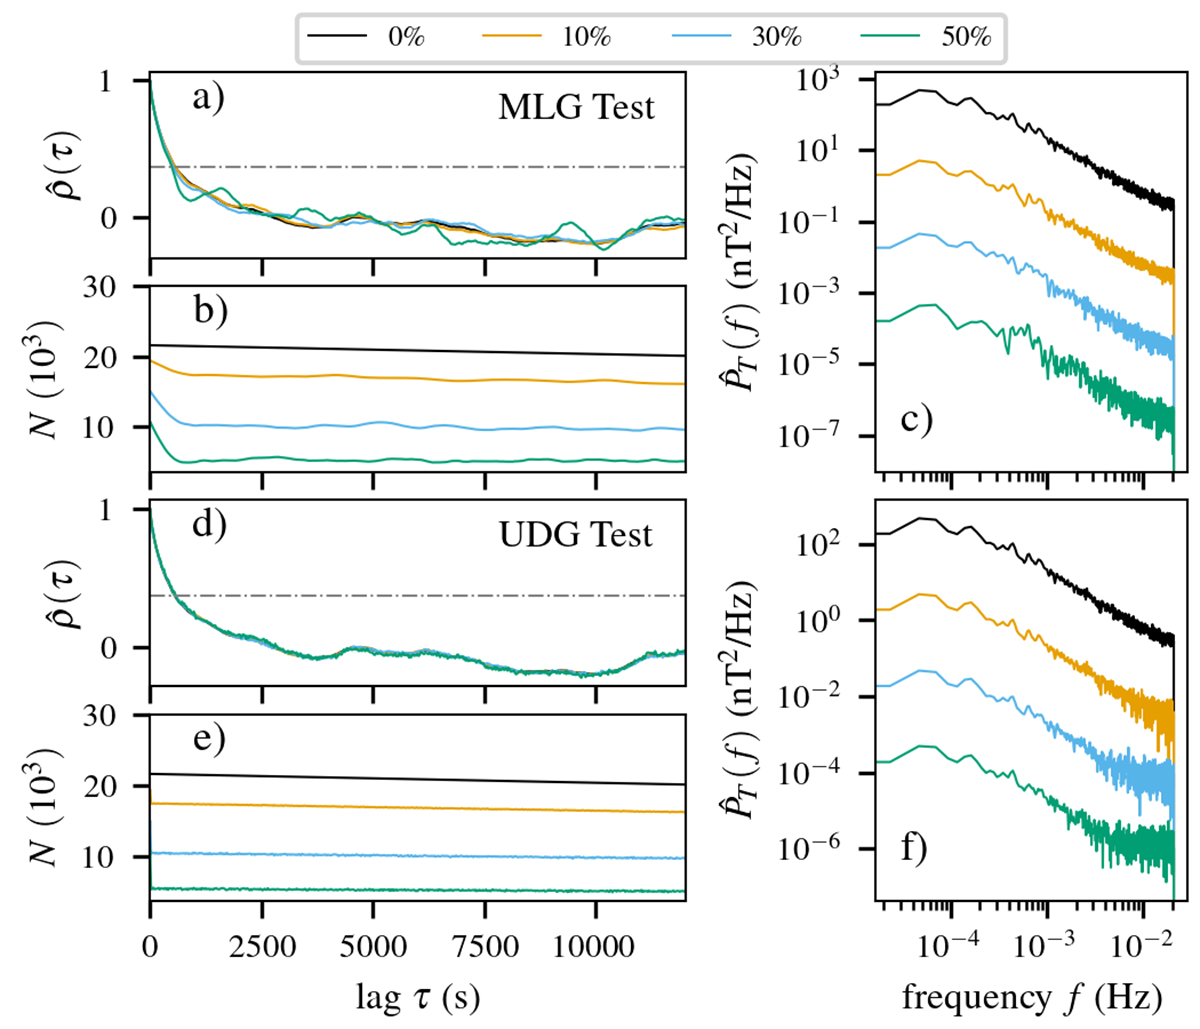
Fig. 4.
Download original image
MLG and UDG tests applied to fast wind interval from January 6–7, 2017. The panels have the same quantities as Figure 2. The statistics in panels (b) and (e) are shown in thousands. Note that the maximum lag shown is less than the six-hour maximum lag used to calculate the PSDs.
Current usage metrics show cumulative count of Article Views (full-text article views including HTML views, PDF and ePub downloads, according to the available data) and Abstracts Views on Vision4Press platform.
Data correspond to usage on the plateform after 2015. The current usage metrics is available 48-96 hours after online publication and is updated daily on week days.
Initial download of the metrics may take a while.