Open Access
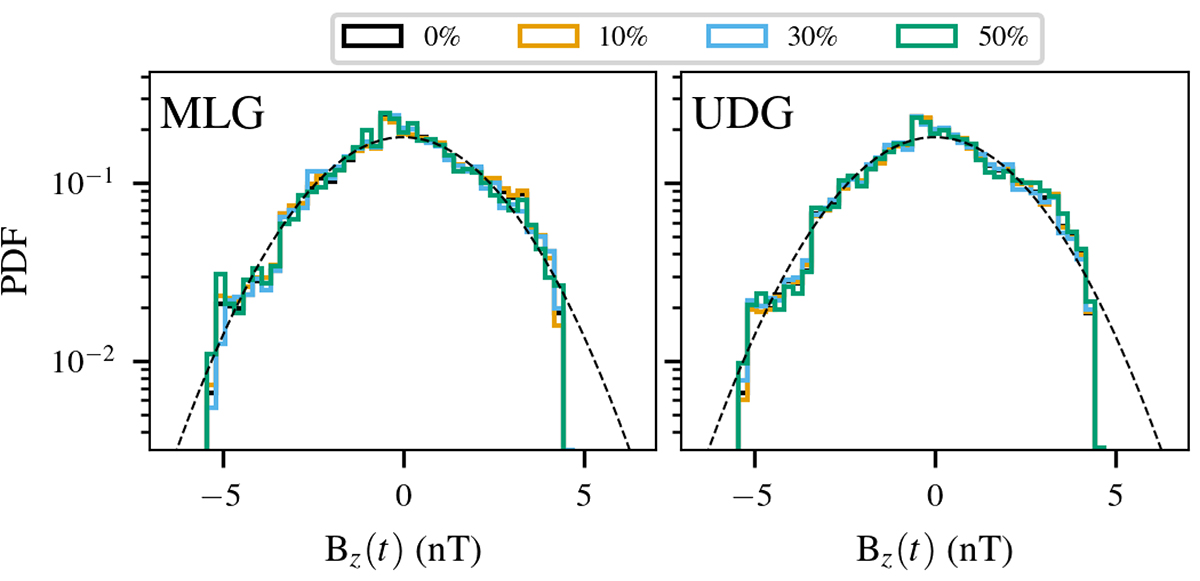
Fig. 3.
Download original image
PDF of the fast wind stream with artificial data gaps added. The data after the MLG method is applied are shown in the left panel, and the UDG method in the right panel. Both methods apply gaps at TGPs of 10%, 30%, and 50%. The dashed black lines show a centered Gaussian distribution with variance 2.2 nT for comparison.
Current usage metrics show cumulative count of Article Views (full-text article views including HTML views, PDF and ePub downloads, according to the available data) and Abstracts Views on Vision4Press platform.
Data correspond to usage on the plateform after 2015. The current usage metrics is available 48-96 hours after online publication and is updated daily on week days.
Initial download of the metrics may take a while.