Fig. 2.
Download original image
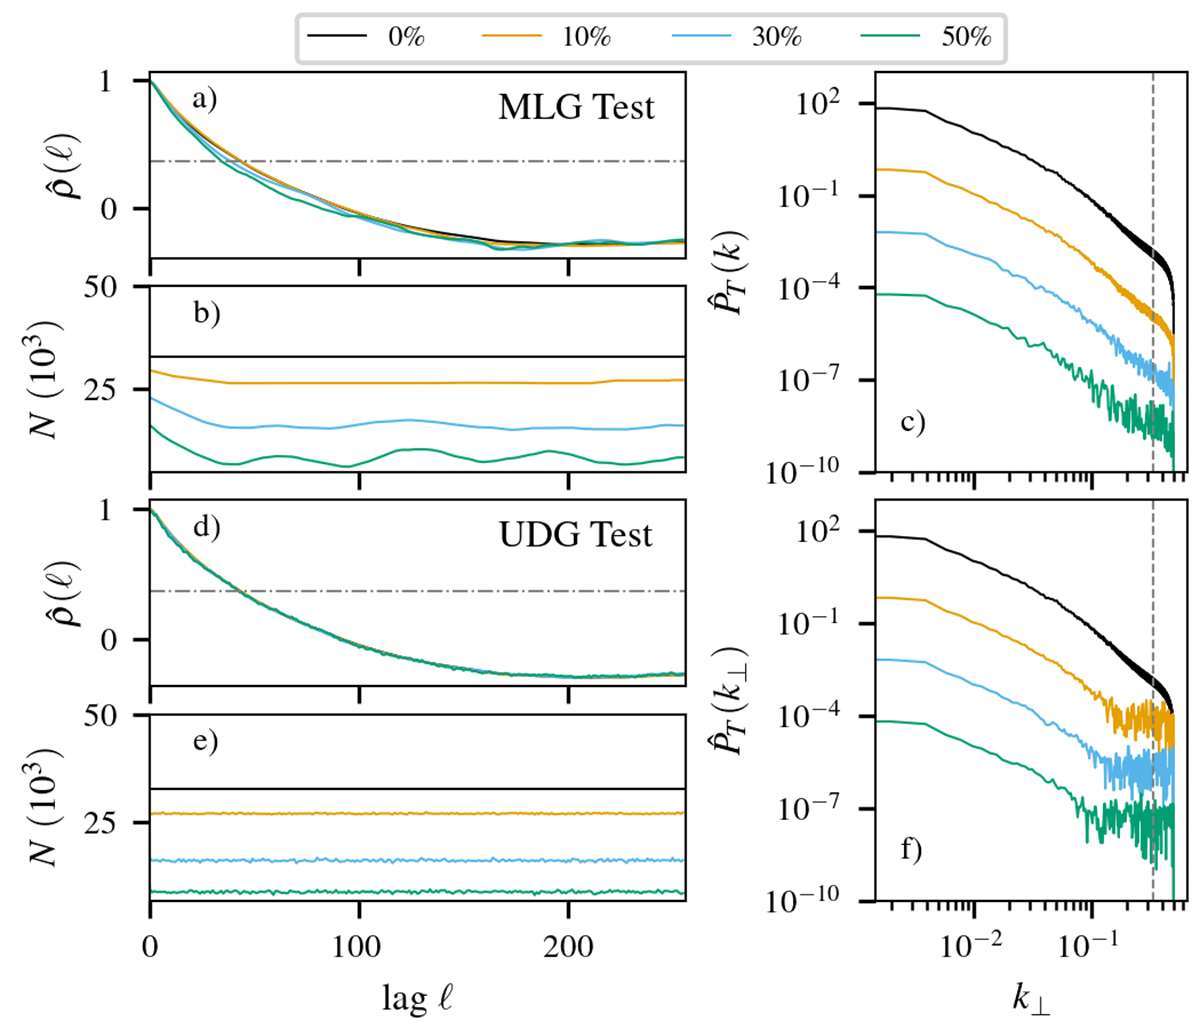
Gaps test applied MHD turbulence simulations. Panels (a), (b), and (c) show the results of the MLG test. Panel (a) shows the normalized ACF; panel (b) shows the number of sampled pairs (in thousands) at each lag; and panel (c) shows the corresponding PSD of the ACF in panel (a). Panels (d)–(f) show the results of the UDG test and show the same quantities as panels (a)–(c), respectively. The black, orange, light blue and green lines are the tests run at 0%, 10%, 30%, and 50% TGPs, respectively. Units are grid points and grid wavenumbers. The PSDs have been artificially offset vertically. The horizontal lines in panels (a) and (d) mark the 1/e value. Vertical lines in panels (c) and (f) mark the high-frequency end of the inertial range in the simulation.
Current usage metrics show cumulative count of Article Views (full-text article views including HTML views, PDF and ePub downloads, according to the available data) and Abstracts Views on Vision4Press platform.
Data correspond to usage on the plateform after 2015. The current usage metrics is available 48-96 hours after online publication and is updated daily on week days.
Initial download of the metrics may take a while.