Fig. 1.
Download original image
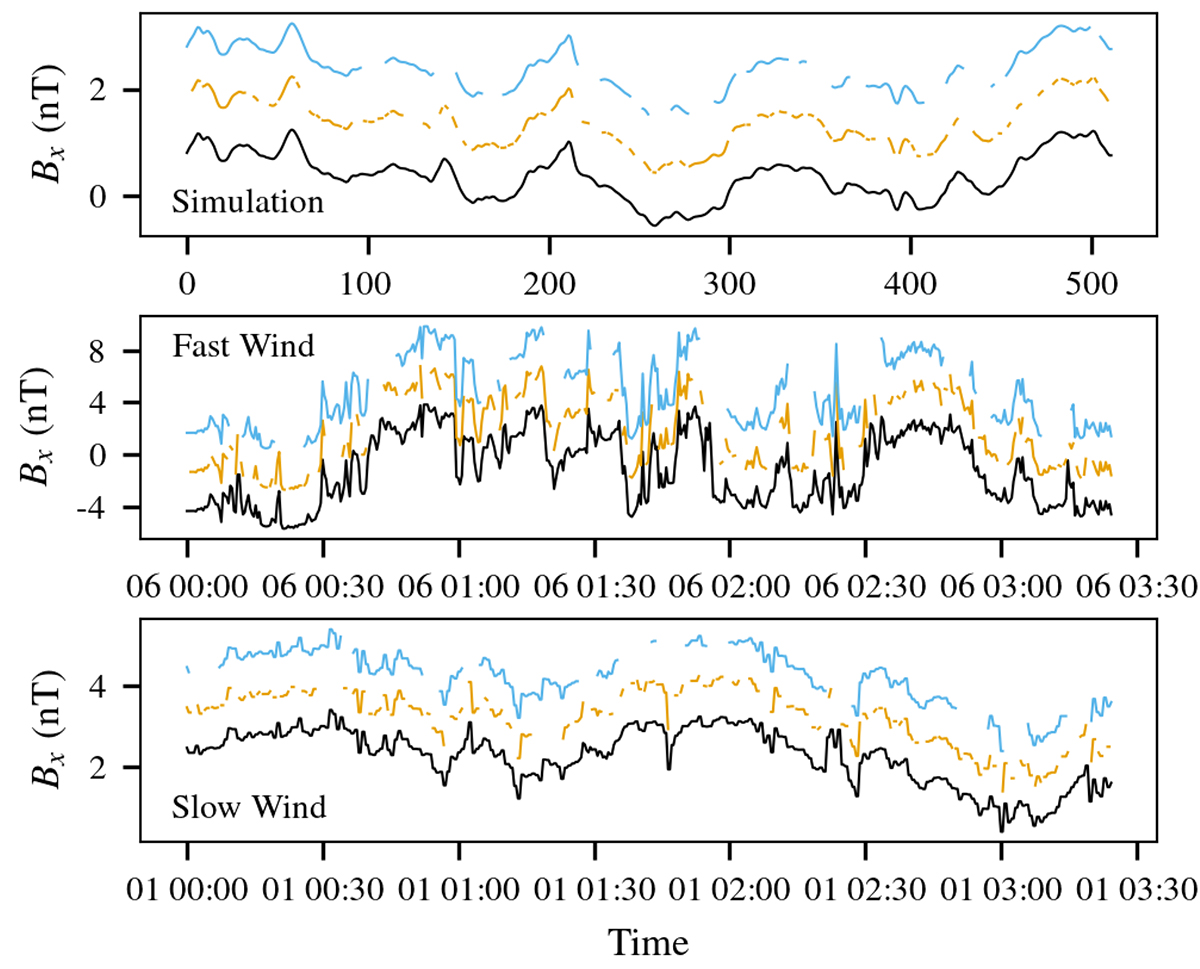
Sample signals for each of the three datasets used in our analysis: simulated MHD turbulence, fast wind from Wind, and slow wind from Wind. The original signals are shown in black. The same signals with the UDG and MLG tests applied at a 30% TGP are shown in orange and light blue, respectively, and have been vertically offset for clarity.
Current usage metrics show cumulative count of Article Views (full-text article views including HTML views, PDF and ePub downloads, according to the available data) and Abstracts Views on Vision4Press platform.
Data correspond to usage on the plateform after 2015. The current usage metrics is available 48-96 hours after online publication and is updated daily on week days.
Initial download of the metrics may take a while.