Fig. 9
Download original image
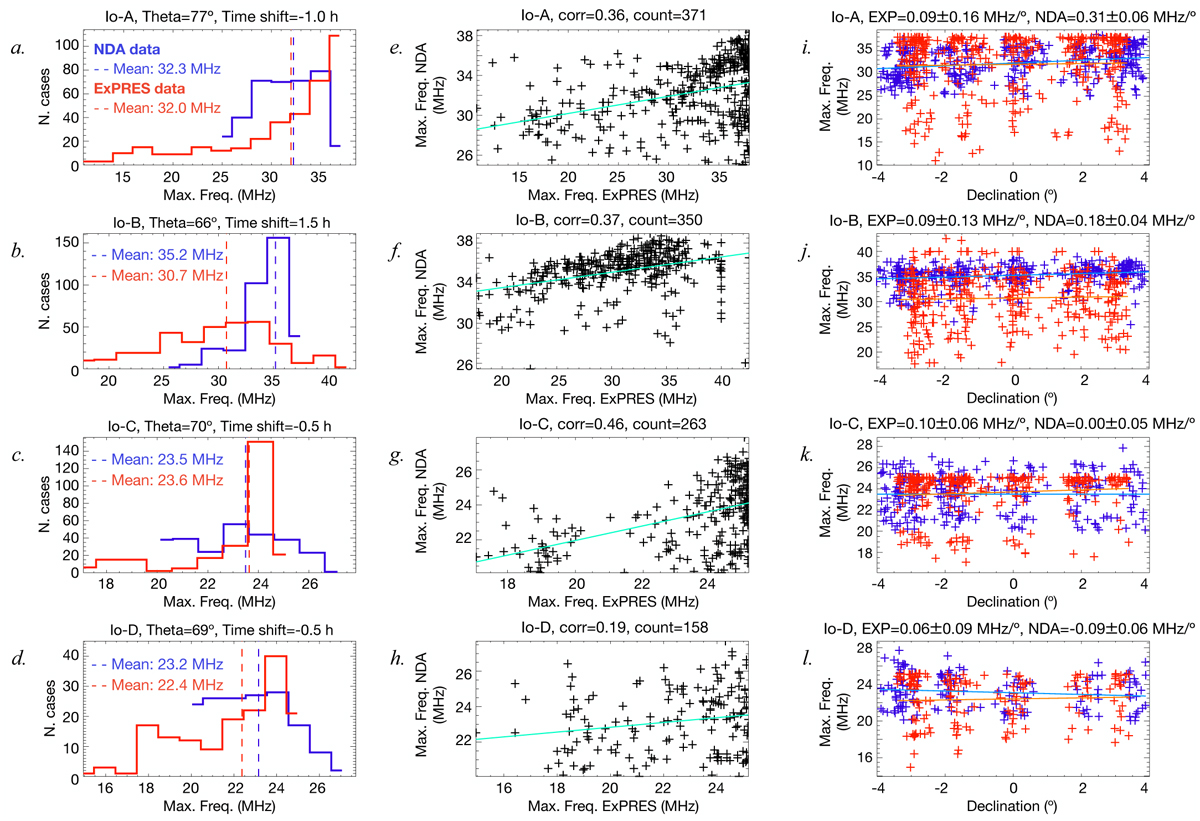
Fmax of the arcs found both in the NDA catalog – after our emission selection – and in the ExPRES simulations, in the δt vs. θmin regions corresponding to the minimum MAD(Fmax) values. Left column: histograms of Fmax of the modeled Io-DAM emissions (in red) and of their corresponding emissions detected with the NDA (in blue). The dashed lines indicate the location of the mean Fmax value of each distribution. The emission type, the δt and θmin are indicated on top of the histograms. Mid column: scatter plots with the Fmax of the Io-DAM arcs observed with the NDA and the Fmax of the respective modeled arcs. The emission type, the correlation factor (corr), and the total number (count) of arcs found both in the real data (NDA arcs) and in the simulations (ExPRES) are indicated on top of the plots. Right column: distribution of Fmax of all the NDA Io-DAM arcs (in blue) and of the corresponding modeled arcs (ExPRES, in red) as a function of DE. The lines (in the respective colors) are linear fits to the data. The slopes of the linear fits are indicated on top of the plots (ExP for the modeled emissions – red; and NDA, for the NDA emissions – blue).
Current usage metrics show cumulative count of Article Views (full-text article views including HTML views, PDF and ePub downloads, according to the available data) and Abstracts Views on Vision4Press platform.
Data correspond to usage on the plateform after 2015. The current usage metrics is available 48-96 hours after online publication and is updated daily on week days.
Initial download of the metrics may take a while.