Fig. 8
Download original image
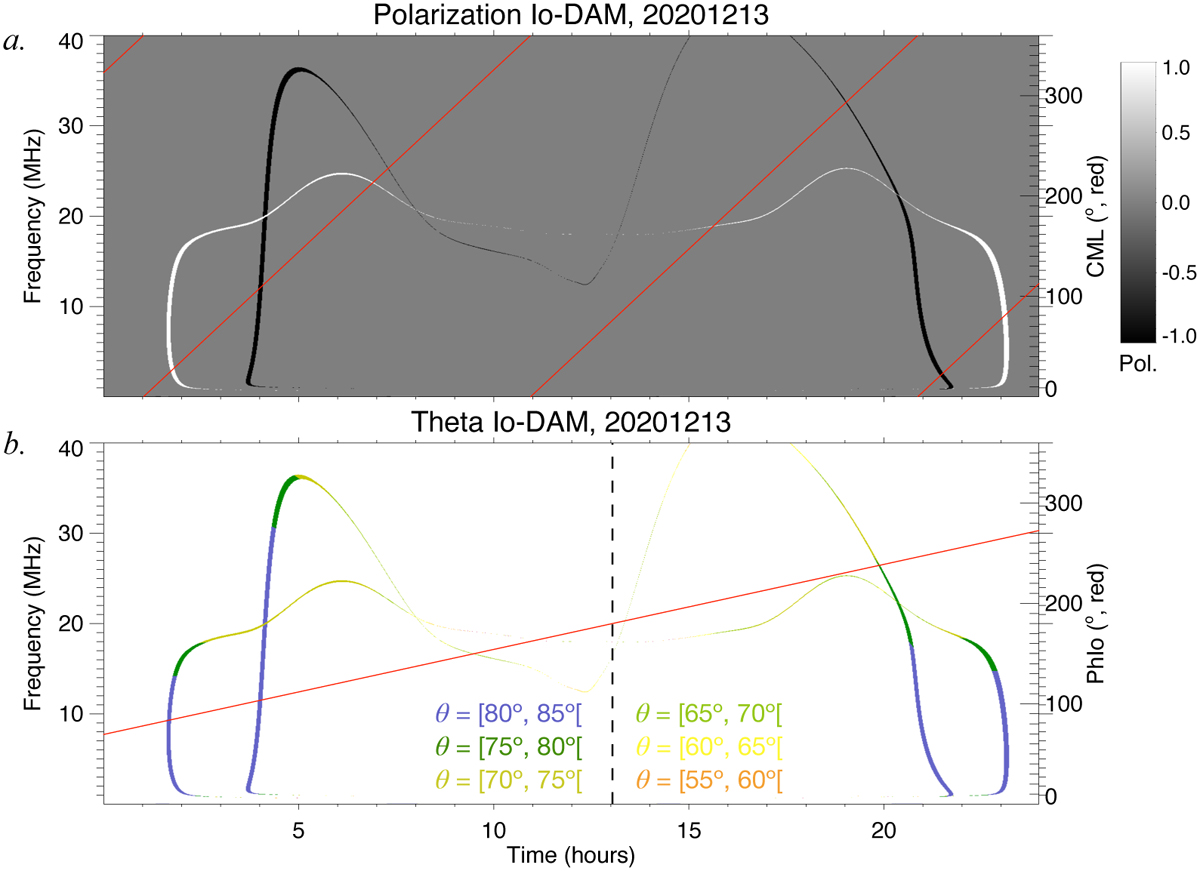
Io-DAM arcs modeled by ExPRES for the December 13, 2020. The polarization of the arcs (a) and the respective values of the beaming cone aperture angle θ (b) are shown in t-f planes. The variation in the observer’s (at the Earth) ϕIo is shown in red in plot a, and the variation in ϕIo (PhIo) is indicated also in red in plot b. The dashed black line indicates the moment when ϕIo is 180°. For ϕIo < 180°, the emissions are labeled as Io-B or Io-D; and for ϕIo ≥ 180°, the emissions are labeled as Io-A or Io-C.
Current usage metrics show cumulative count of Article Views (full-text article views including HTML views, PDF and ePub downloads, according to the available data) and Abstracts Views on Vision4Press platform.
Data correspond to usage on the plateform after 2015. The current usage metrics is available 48-96 hours after online publication and is updated daily on week days.
Initial download of the metrics may take a while.