Fig. 3
Download original image
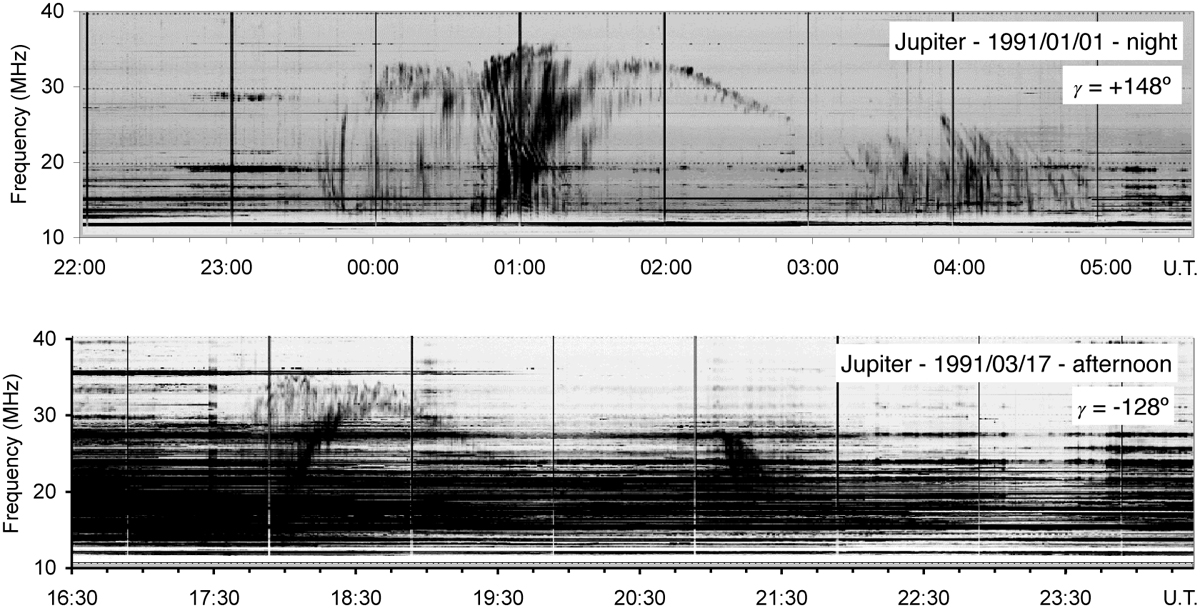
Examples of dynamic spectra of Jupiter recorded by the NDA with its Routine receiver. The top panel illustrates the ionospheric and RFI conditions at night. The bottom panel illustrates those conditions during daytime. Vertical lines are calibration sequences. Jupiter’s decameter emission is structured in “arcs” in the t-f plane. The horizontal black lines are RFI. This figure is adapted from Lecacheux (2000).
Current usage metrics show cumulative count of Article Views (full-text article views including HTML views, PDF and ePub downloads, according to the available data) and Abstracts Views on Vision4Press platform.
Data correspond to usage on the plateform after 2015. The current usage metrics is available 48-96 hours after online publication and is updated daily on week days.
Initial download of the metrics may take a while.