Fig. B.5
Download original image
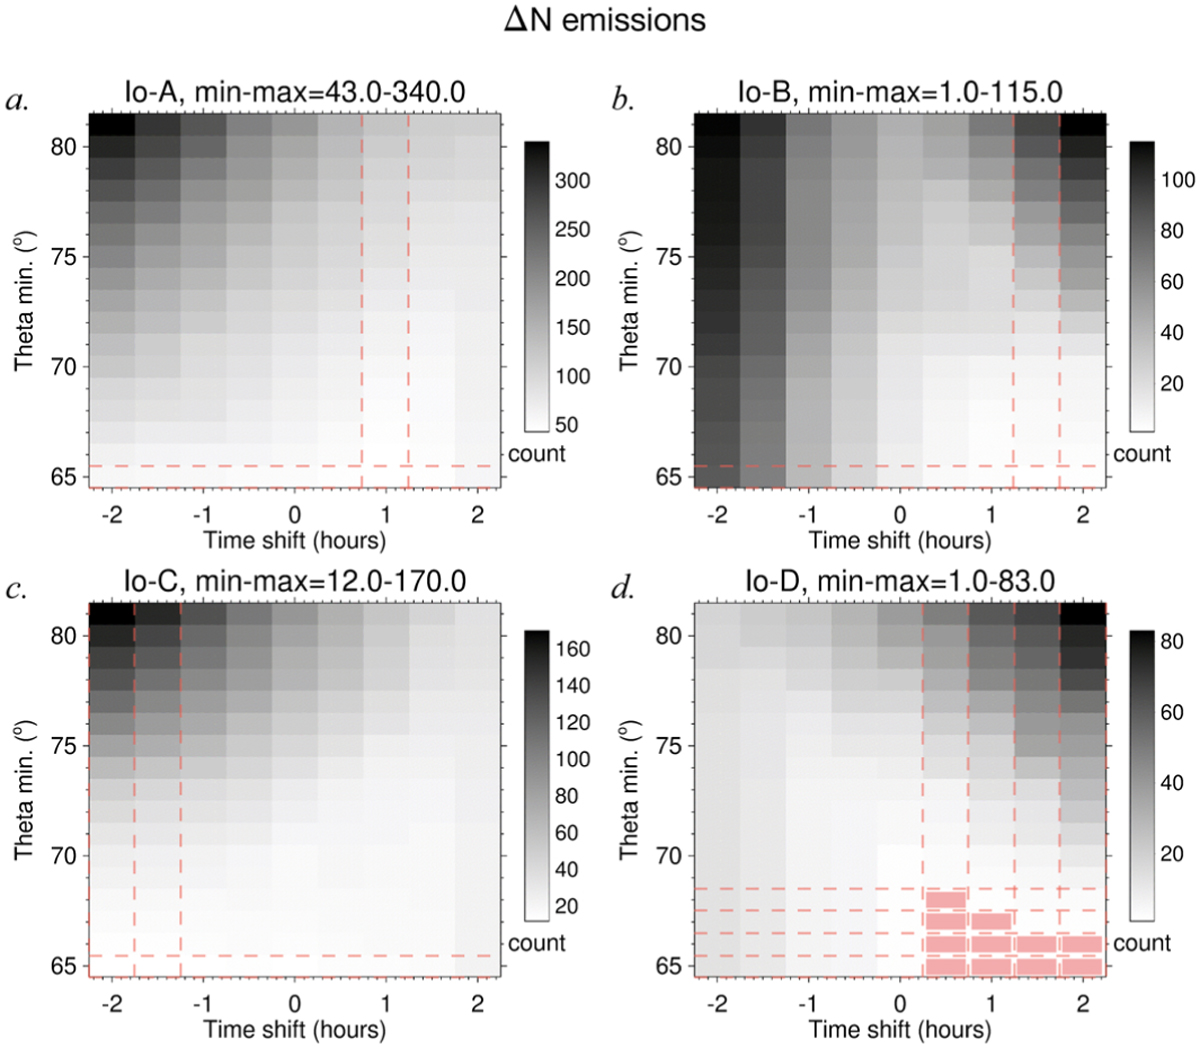
Distribution of the absolute differences between the count of Io-DAM emissions simulated by the ExPRES within the NDA observation windows and the count of real emissions observed by the NDA (after the selection by intensity and Fmax). The dashed lines indicate the regions of minimum difference. The salmon rectangles indicate the multiple regions where minimum difference in count was found for the Io-D emissions.
Current usage metrics show cumulative count of Article Views (full-text article views including HTML views, PDF and ePub downloads, according to the available data) and Abstracts Views on Vision4Press platform.
Data correspond to usage on the plateform after 2015. The current usage metrics is available 48-96 hours after online publication and is updated daily on week days.
Initial download of the metrics may take a while.