Fig. A.1
Download original image
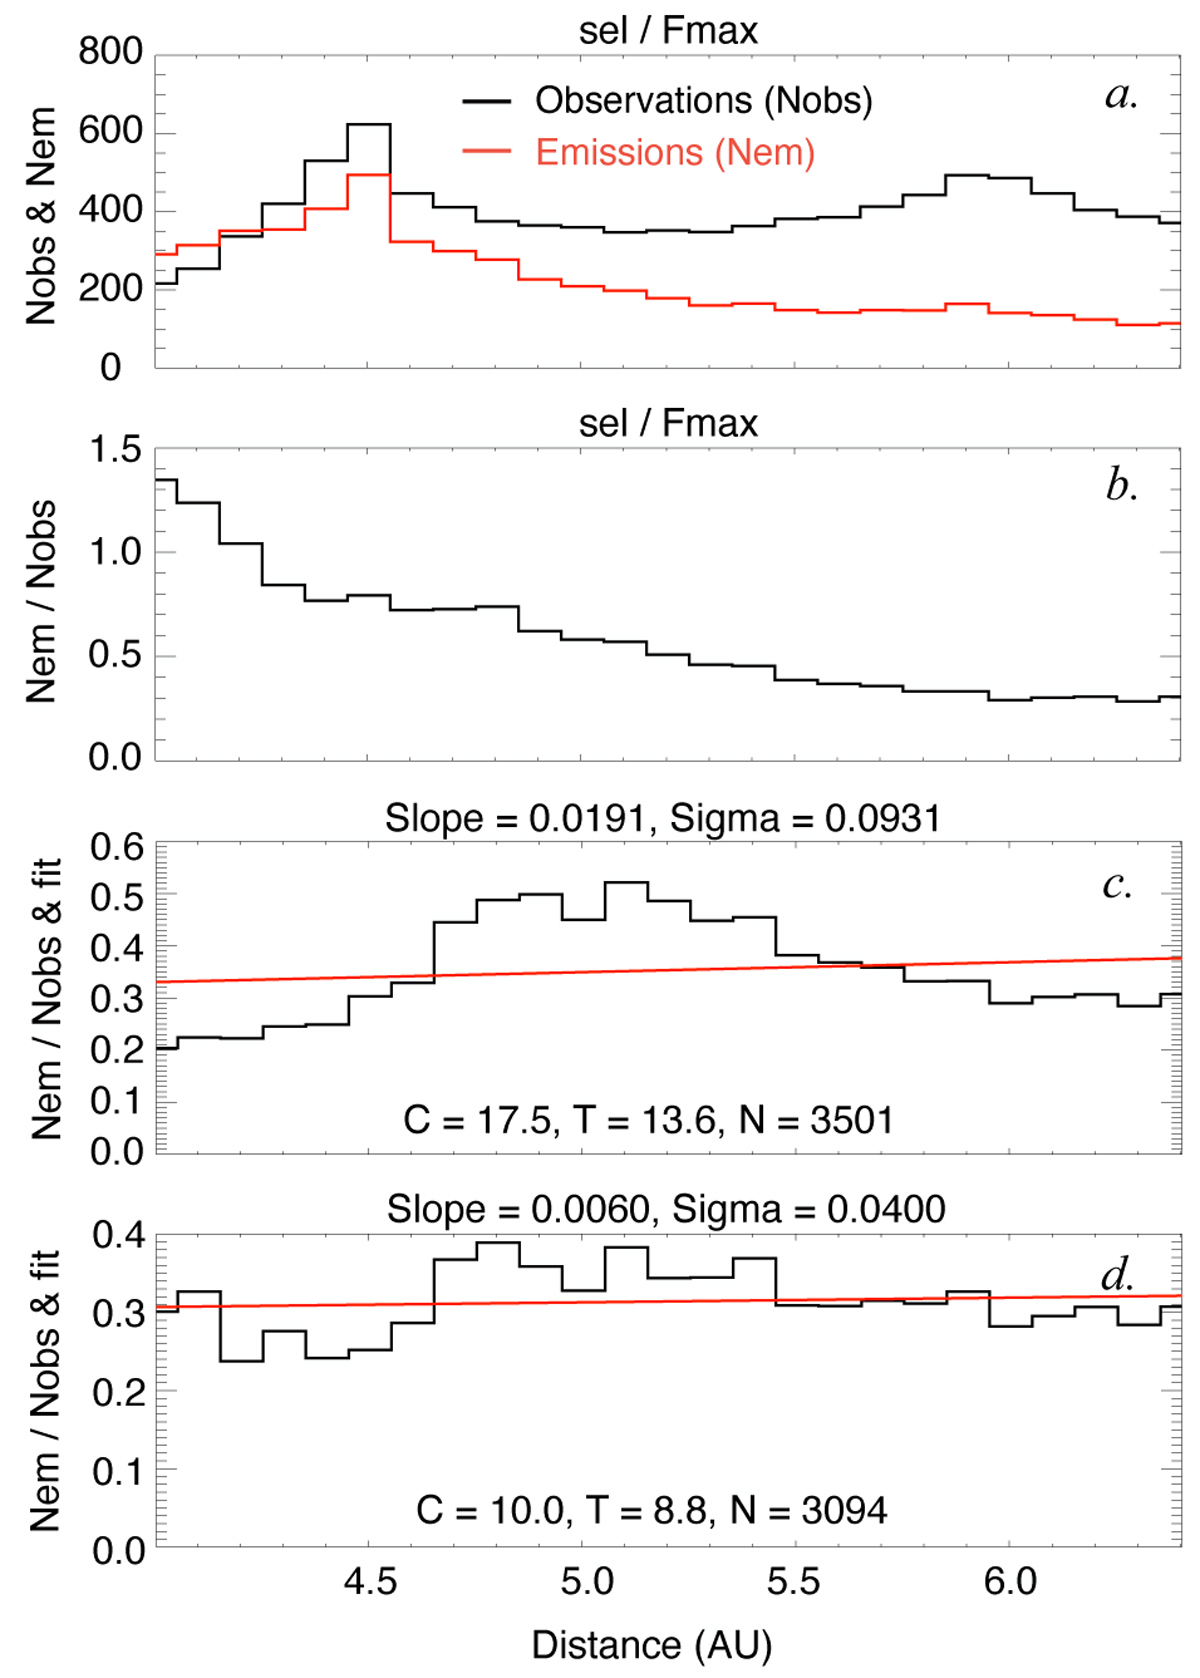
Representation of the parametric analysis of the distribution of Jovian DAM emissions (Nem) as a function of R. Panel a: Histograms of the observations (Nobs) of Jupiter (in black), and of Nem (in red) for emissions selected by Fmax from the NDA/Routine catalog. Panel b: Histogram of the ratio between the Nem and Nobs of panel a. Panel c: Histogram of the ratio Nem/Nobs for the emissions with intensity corrected with C = 17.5 above a threshold T = 13.6 dB. Panel d: Histogram of the ratio Nem/Nobs for the emissions with intensity corrected with C = 10 above a threshold T = 8.8 dB. N indicates the total number of emissions selected by Fmax with Icor ≥ T. The red lines are linear fits to the distributions. The linear fits’ slope is indicated on top of each diagram with the dispersion of the data around the fit (Sigma).
Current usage metrics show cumulative count of Article Views (full-text article views including HTML views, PDF and ePub downloads, according to the available data) and Abstracts Views on Vision4Press platform.
Data correspond to usage on the plateform after 2015. The current usage metrics is available 48-96 hours after online publication and is updated daily on week days.
Initial download of the metrics may take a while.