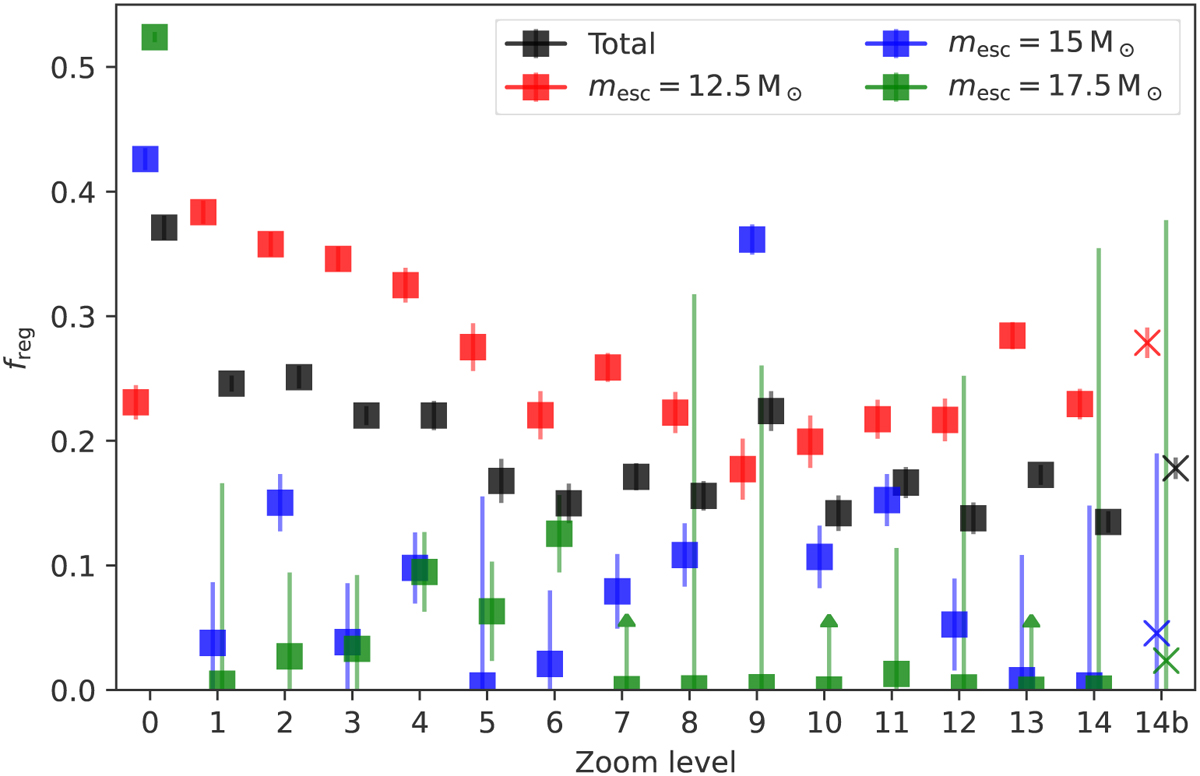
Fig. 7
Download original image
Fraction of regular interactions (fcol > 2/3, k = 9) for each zoom level. Zoom level 0 denotes the whole initial parameter space (ι ∈ [0, π], λ ∈ [0, 2π)). Red, blue and green indicate the relative fraction (with respect to interactions of the same colour) of regular interactions where the 12.5, 15 or 17.5 M⊙ particle escapes, respectively. The black line is the total fraction of regular interactions. The error range indicates the maximum between the Poissonian error and the difference in fraction estimate using k = 6 and k = 12 neighbours. The results for the 14th zoom-in are repeated using an arbitrary precision integrator, see Sect. 5.
Current usage metrics show cumulative count of Article Views (full-text article views including HTML views, PDF and ePub downloads, according to the available data) and Abstracts Views on Vision4Press platform.
Data correspond to usage on the plateform after 2015. The current usage metrics is available 48-96 hours after online publication and is updated daily on week days.
Initial download of the metrics may take a while.