Fig. 5
Download original image
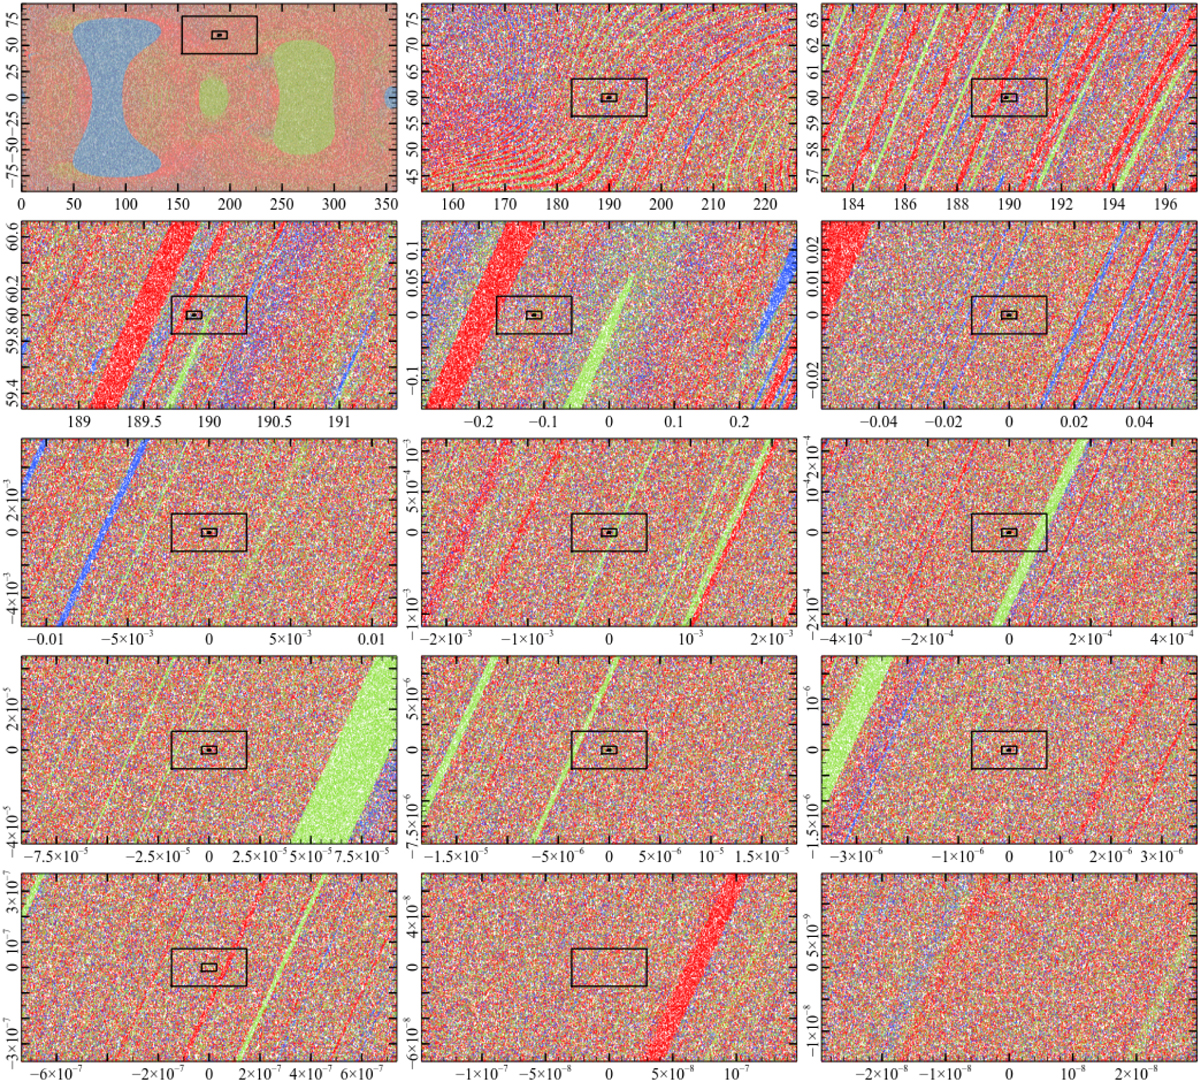
Space of the initial configurations. The x-axis represents the phase, or true longitude λ of the initial binary. The y-axis represents the inclination ι of the binary with respect to the line joining the binary centre-of-mass and the incoming single. In the first row, the absolute values are shown in degrees, while the other rows are shown as offset degrees from the central value. Each dot represents an initial configuration in λ − i space, whose colour identifies the identity of the ejected particle. Red: 12.5 M⊙. Blue: 15 M⊙. Green: 17.5 M⊙. Regions of sparse density may appear as white dots due to the white background. From left to right and top to bottom: each panel is a 5 × 5 zoomed-in version of the previous. The black boxes show the boundary box of the next three zoomed regions.
Current usage metrics show cumulative count of Article Views (full-text article views including HTML views, PDF and ePub downloads, according to the available data) and Abstracts Views on Vision4Press platform.
Data correspond to usage on the plateform after 2015. The current usage metrics is available 48-96 hours after online publication and is updated daily on week days.
Initial download of the metrics may take a while.