Fig. 4
Download original image
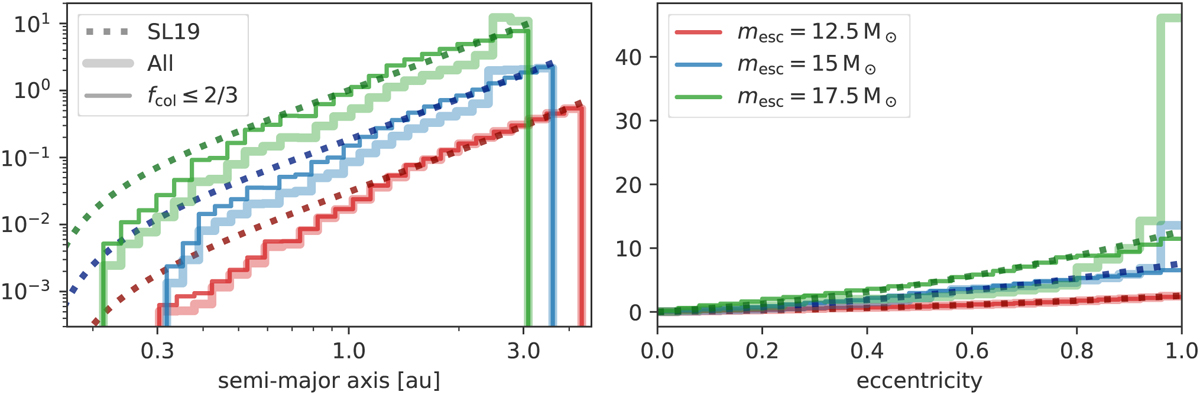
Distributions of semi-major axes (left panel) and eccentricity (right panel) of the final binary for the entire initial phase space (i.e. the one in Fig. 3). The colours indicate the identity of the escaped particle, while the dashed lines indicate the predictions of the statistical escape theory of Stone & Leigh (2019). Thin lines: considering all simulations. Thick lines: excluding the regular islands (fcol ≤ 2/3). In the left panel, we magnified the differences in semi-major axes distributions among different escaper by introducing different normalizations (×0.9 for red, ×3 for blue, ×20 for green). In the right panel, the analytic predictions for the eccentricity distributions for different escapers would be virtually identical, so we introduced different normalizations (×3 for blue, ×5 for green) to better distinguish the coloured lines.
Current usage metrics show cumulative count of Article Views (full-text article views including HTML views, PDF and ePub downloads, according to the available data) and Abstracts Views on Vision4Press platform.
Data correspond to usage on the plateform after 2015. The current usage metrics is available 48-96 hours after online publication and is updated daily on week days.
Initial download of the metrics may take a while.