Fig. 3
Download original image
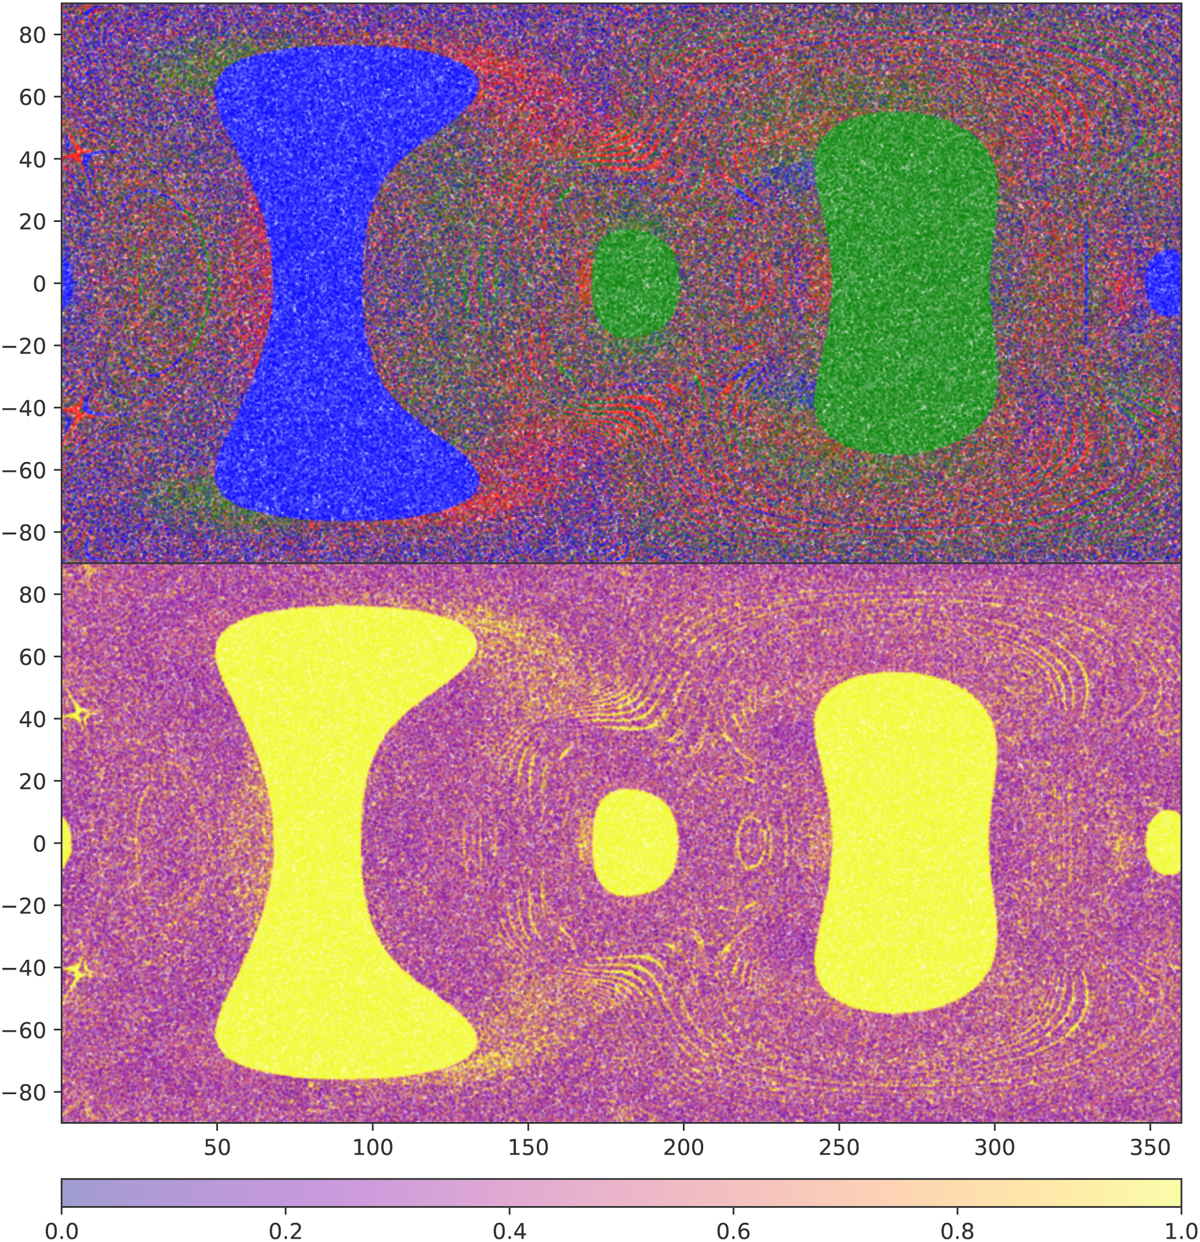
Initial condition space in inclination ι (y-axis) and true longitude λ (x-axis). Each dot represents an individual realization among 106. Top panel: colour-coded by the identity of the escaping particles. Red: 12.5 M⊙. Blue: 15 M⊙. Green: 17.5 M⊙. Regions of sparse density may appear as white dots due to the white background. Bottom panel: fraction of same-colour neighbouring particles fcol, out of k = 12 nearest neighbours.
Current usage metrics show cumulative count of Article Views (full-text article views including HTML views, PDF and ePub downloads, according to the available data) and Abstracts Views on Vision4Press platform.
Data correspond to usage on the plateform after 2015. The current usage metrics is available 48-96 hours after online publication and is updated daily on week days.
Initial download of the metrics may take a while.