Fig. B.1
Download original image
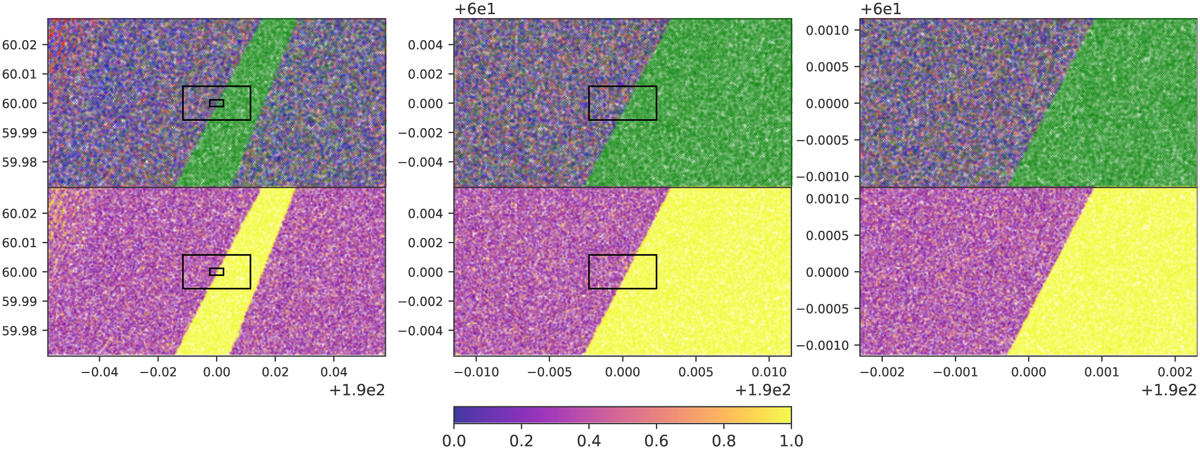
From left to right: initial condition space of the alternative zoom-ins for the zoom levels 5, 6 and 7, in inclination ι (y-axis) and true longitude λ (x-axis). As in Figure 3, the dots are colour-coded by the identity of the escaping particles. Red: 12.5 M⊙. Blue: 15 M⊙. Green: 17.5 M⊙. Bottom panels: fraction of same-colour neighbouring particles fcol, out of k = 9 nearest neighbours. The black boxes show the boundary box of the next zoomed regions.
Current usage metrics show cumulative count of Article Views (full-text article views including HTML views, PDF and ePub downloads, according to the available data) and Abstracts Views on Vision4Press platform.
Data correspond to usage on the plateform after 2015. The current usage metrics is available 48-96 hours after online publication and is updated daily on week days.
Initial download of the metrics may take a while.